LTPBR V2 DCE Protocol
This protocol is production grade and fully supported in QRiS. Layers and metrics have been finalized by the owner to be used in data collection & metric calculation. Updates may occur to existing layers or metrics but will not result in data loss to the user.
Overview
The LTPBR V2 DCE (Data Capture Events) Protocol provides a standardized method for monitoring riverscape changes over time, using both visual and numerical data. This protocol enables users to digitize the location, distribution, and characteristics of riverscape features, which can then be used to assess the health and function of a riverscape.
A key benefit of the DCE protocol is its versatility, allowing for riverscape assessments throughout all phases of a restoration project (design, implementation, and monitoring). This enables users to evaluate project effectiveness and identify potential changes where needed. It can also be used to identify areas with high restoration potential, thereby informing site selection for LTPBR projects.
QRiS offers powerful analytical functions that present data in both graphs and tables, enabling users to quantify temporal changes and identify limiting factors. This numerical and visual approach provides the necessary insights to make informed decisions for restoration projects. The system also allows for an unlimited number of DCEs per project, providing flexibility to organize riverscape surveys and assessments into distinct events or combine multiple surveys into a single DCE as required.
Protocol Summary
| Attribute | Value |
|---|---|
| Name | LTPBR V2 DCE Protocol |
| Status | Production Grade |
| Version | 1.0 |
| XML URL | https://github.com/Riverscapes/RiverscapesXML/blob/master/QRiS/protocols/ltpbr_protocol.xml |
| Citation | Weber N., Wheaton J.M., Shalcross A., Al-Chokhachy R, Bailey P., Bartelt K., Bennett S., Bouwes B., Bouwes N., Gilbert J., Dickard M., Heitke J., Jordan C., Glassic H., MacFarlane W.W., Miller S., Saunders C., Whitehead K. 2024. Low-Tech Process-Based Restoration Design and Monitoring Protocol: Standard Methods for Developing Project Designs and Assessing Riverscape Health. Version 2.0. Prepared by Anabranch Solutions and Utah State University Riverscapes Assessment and Monitoring Lab. Prepared for the Bureau of Land Management. Logan, UT. 81 pp. DOI: 10.5281/zenodo.13769899 |
| Author | Nick Weber |
Layers & Metrics
- Active Channel Extents
- Active Channel Lines
- Active Extents
- Channel Junctions
- Dam Crests
- Cluer and Thorne
- Geomorphic Units
- Inundation Extents
- Observations
- Recovery Space
- Risk Potential
- Structural Elements
- Vegetation Extents
| Type | Metrics | Description |
|---|---|---|
| Polygon | % Inundated | Mapping of the active channel extent |
| Type | Metrics | Description |
|---|---|---|
| Line | Channel Sinuosity,Channel Length, Primary Channel Length, Secondary Channel Length, Relative Flow Length | Mapping of the active channel planform as primary and non-primary channels |
| Type | Metrics | Description |
|---|---|---|
| Polygon | Proportion of Active Valley Bottom | Classification and mapping the riverscape area that is part of the current active channel and floodplain; i.e., the 'active' portion of the valley bottom |
| Type | Metrics | Description |
|---|---|---|
| Point | Floodplain Channel Head Count, Floodplain Channel Head Density, Confluence Count, Confluence Density, Diffluence Count, Diffluence Density | Mapping the abundance and distribution of active channel confluences, diffluences, and channel heads |
| Type | Metrics | Description |
|---|---|---|
| Line | NA | Representation of the crest profile of natural and/or artificial dams, used to produce metrics that include dam abundance and total crest length (from Bartelt et al. 2021). |
| Type | Metrics | Description |
|---|---|---|
| Polygon | SEM Stage 0 Area, SEM Stage 1 Area, SEM Stage 2 Area, SEM Stage 3 Area, SEM Stage 4 Area, SEM Stage 5 Area, SEM Stage 6 Area, SEM Stage 7 Area, SEM Stage 8 Area | Classification of the riverscape according to the stream evolution model stages described by Cluer and Thorn 2014 |
| Type | Metrics | Description |
|---|---|---|
| Point, Polygon | Mid Channel Bar Count, Mid Channel Bar Density, Mid Channel Bar Area, Riffle Count, Riffle Density, Riffle Area, Pool Count, Pool Density, Pool Area | Representation of the distribution and characteristics of geomorphic features within the active channel. Used to produce estimates of habitat complexity and quantity |
| Type | Metrics | Description |
|---|---|---|
| Polygon | % Free Flowing, % Overflow, % Backwater/Ponded, Free Flowing Area, Overflow Area, Ponded Area | Mapping the distribution of simple surface-flow types such as ponded, free-flowing, and overflowing. Used to generate metrics of increasing habitat complexity, quantity, and floodplain connectivity (from Bartelt et al. 2021) |
| Type | Metrics | Description |
|---|---|---|
| Point, Line, Polygon | NA | A flexible set of layers used to document practical, logistical, and cautionary features that are relevant to LTPBR implementation and monitoring |
| Type | Metrics | Description |
|---|---|---|
| Polygon | Percent Recovery Space | Mapping the extent of the valley bottom over which aquatic processes might be invoked given restoration or management changes |
| Type | Metrics | Description |
|---|---|---|
| Polygon | NA | Identification and mapping of anthropogenic features that would limit the area available for riverscape expansion (i.e., limit recovery potential) |
| Type | Metrics | Description |
|---|---|---|
| Point, Line, Polygon | Jam Count,Jam Area, Jam Density,Dam Count, Dam Density | Maps the distribution and characteristics of structural elements (natural and artificial woody debris jams and beaver dams) |
| Type | Metrics | Description |
|---|---|---|
| Polygon | % Riparian Vegetation | Classification and mapping of vegetated portions of the valley bottom where the vegetation assemblage is dominated by riparian and wetland species |
Details
How to Use This Protocol
The protocol uses multiple layers organized into two separate groups. The Observations group contains layers related to riverscape features and structural elements, while the Assessments group contains layers related to risk potential, channel evolution models, and beaver dam building.
- Observations: structural elements, observations, vegetation extents, inundation extents, active extents, active channel, active channel lines, channel junctions, geomorphic unit extents, geomorphic units.
- Assessments: risk potential, SEM Cluer and Thorne, dam crests, recovery potential.
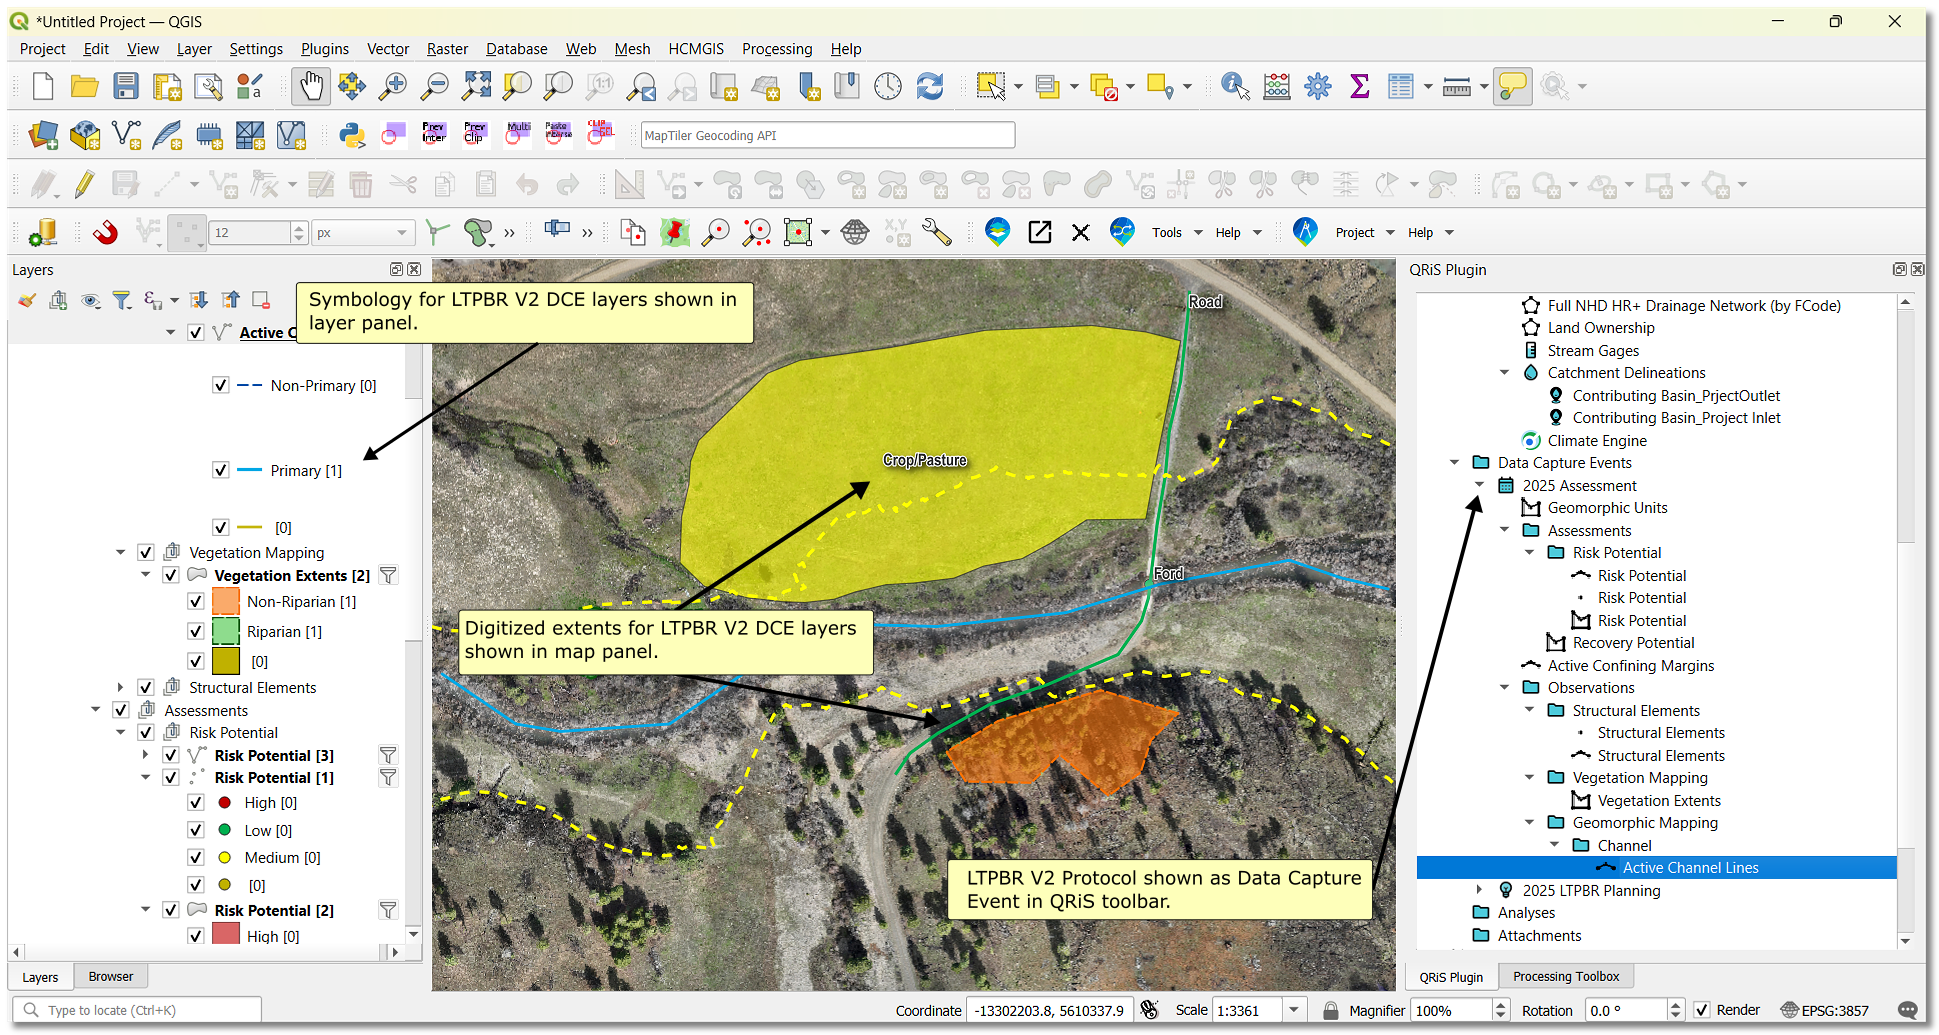 Example of LTPBR V2 DCE protocol in practice at Wall Creek. Digitized layer extents and symbology are stored in the QRiS geopackage and can be displayed in any QGIS (.qgz) project.
Video Demonstration
Layer Attributes
- Active Channel Lines
- Active Extents
- Channel Junctions
- Cluer and Thorne
- Dam Crests
- Geomorphic Units
- Inundation Extents
- Risk Potential
- Structural Elements
- Vegetation Extents
| Type | Description |
|---|---|
| Primary | The continuous channel thread that carries the largest proportion of the total surface flow |
| Non-Primary | Any other active channel thread. Non-primary channels are separated from the main channel by islands that are generally vegetated. Non-primary channels should not be drawn for thalwegs around bar features that are still a part of the active channel |
| Description | Description |
|---|---|
| Centerline | The approximate centerline of the active channel |
| Thalweg | The approximate thalweg, which is generally the deepest point along a channel cross-section or point that carries the greatest amount of flow. |
| Type | Description |
|---|---|
| Active | The combined portion of the valley bottom classified as part of the active channel and floodplain under the current geomorphic and hydrologic conditions. |
| Inactive | The portion of the valley bottom that is not part of the active channel or floodplain under current geomorphic and hydrologic conditions. |
| Type | Description |
|---|---|
| Diffluence | Location where an active, non-primary channel splits away (diverges) from the primary channel or another non-primary channel. Difluences are the upstream end of any non-primary active channel |
| Confluence (Anabranch) | Approximate location where an active non-primary channel reenters the primary channel or another non-primary channel. Confluences are the downstream end of any non-primary active channel |
| Confluence (Tributary) | Location where a tributary enters an active channel |
| Channel Head | Channel heads are one mechanism in which new anabranches are created. Channel heads are distinguished as the most upstream point at which flow becomes concentrated between definable banks. The downstream point in which the anabranch channel meets the main channel should be marked as a channel head confluence |
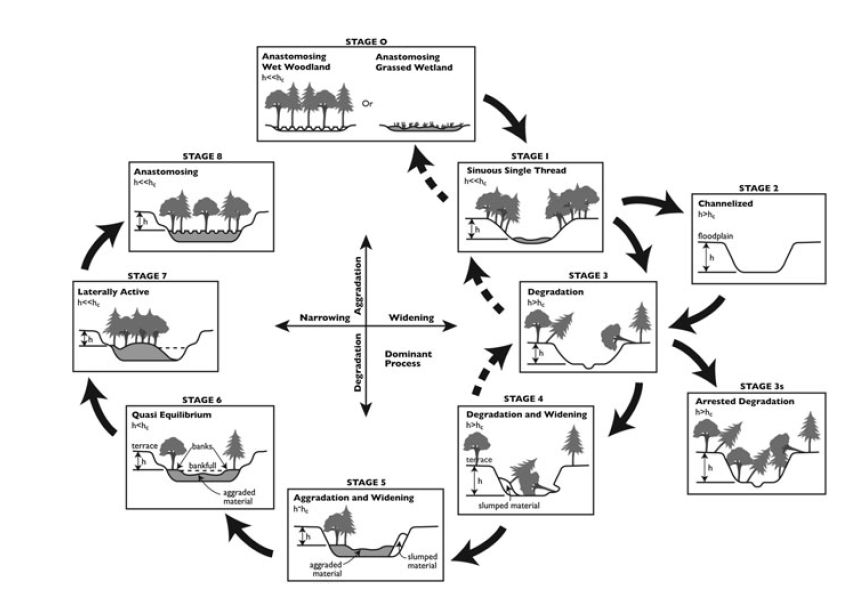
| SEM Stage | Description |
|---|---|
| Stage 1-Sinuous, Single Thread | Dynamically stable and laterally active channel within a floodplain complex |
| Stage 2-Channelized | Re-sectioned land drainage, flood control, or navigation channels |
| Stage 3-Degradation/Arrested Degradation | Incising and abandoning its floodplain. Featuring head cuts, knick points or knick zones that incise into the bed, scours away bars and riffles and removes sediments stored at bank toes. Banks stable geotechnically. |
| Stage 4-Degradation and Widening | Incising with unstable, retreating banks that collapse by slumping and/or rotational slips. Failed material is scoured away, and the enlarged channel becomes disconnected from its former floodplain, which becomes a terrace. |
| Stage 5-Aggradation and Widening | Bed rising, aggrading, widening channel with unstable banks in which excess load from upstream together with slumped bank material build berms and silts bed. Banks are stabilizing and berming. |
| Stage 6-Quasi Equilibrium | Inset floodplain re-established quasi-equilibrium channel with two-stage cross-section featuring regime channel inset within larger, degraded channel. Berms stabilize as pioneer vegetation traps fine sediment, seeds and plant propagules. |
| Stage 7-Laterally Active | Channel with frequent floodplain connection develops sinuous course, is laterally active and has symmetrical cross-section promoting bar accretion at inner margins and toe scour and renewed bank retreat along outer margins of expanding/migrating beds |
| Stage 8-Anastomosing Meta-Stable Channel Network | Post-disturbance channel featuring anastomosed planform connected to a frequently inundated floodplain that supports wet woodland or grassland that is bounded by set-back terraces on one or both margins. |
| Stage 0-Anastomosing Wet Woodland or Anastomosing Grassed Wetland | Pre-disturbance, dynamically meta-stable network of anabranching channels and floodplain with vegetated islands supporting wet woodland or grassland |
| Structure Source | Description |
|---|---|
| Natural | Dam was originally constructed by beaver |
| Artificial | Dam was constructed as a beaver dam analog by restoration construction crew |
| Unknown | Unclear whether the dam was originally constructed by beavers or is a beaver dam analog |
| Dam State | Description |
|---|---|
| Intact | Shows little evidence of breaching or erosion around the structure, flow is primarily spilling over and/or flowing through the structure and water surface gradients are near 0. Dams classified as being intact often show evidence of being actively maintained by beaver |
| Breached | Some evidence of breaching as vegetative material and/or post loss, and/or erosion of the banks or streambed. Flow is concentrated near the breach, but the structure is still impounding water and reducing the water surface gradient and velocity behind the dam |
| Blown | A large portion of the structure has been damaged and/or lost during high flows. Water surface gradient is consistent with the streambed, and velocities are also similar or greater than unimpounded channel sections |
| Crest Type | Description |
|---|---|
| Active | Structure is actively being maintained by beaver |
| Inactive | There is evidence of past maintenance by beaver, applicable to natural dams if maintenance is not fresh (active) |
| Unit Type | Tier 1 | Tier 2 | Description |
|---|---|---|---|
| Pool | Concavity | Bowl | Pools are bowl shaped channel concavities that are laterally and longitudinally concave. |
| Pond | Concavity | Bowl | Surface water impoundment caused by a flow obstruction such as a beaver dam or woody debris jam. |
| Chute | Concavity | Trough | Laterally concave and elongate units that are typically steeper shortcuts or flow paths that dissect bar features or form on the inside of channel meanders. |
| Riffle | Convexity | Saddle | A bar that is margin attached on both sides (either to banks or other bars) with a crest that acts as a weir. They are longitudinally convex, but concave in cross section. Often formed because of deposition downstream of pool units (i.e., pool-tails). |
| Mid Channel Bar | Convexity | Mound | Lateral and longitudinal convexities formed by deposition of bed material during high stream power events. Bar features are often only partially inundated or could be completely dry during baseflow. |
| Bank Attached Bar | Convexity | Mound | Similar to mid-channel bars but attached to banks on the inside of channel meanders. Commonly referred to as ‘point bars’. |
| Glide/Run | Planar | Planar | Low-slope planar features. These sections of channel lack convex or concave shape and are neither depositional nor erosional (i.e., transport). |
| Rapid | Planar | Panar | Steeper gradient than Glide/Run, but also planar unit with higher relative roughness. |
| Type | Description |
|---|---|
| Ponded | structurally-forced backwater ponding behind a channel-spanning structural element. Backwater may be contained within or be outside of the existing active channel |
| Overflow | structurally-forced flow out of the active channel floodplain and/or otherwise exposed in channel surfaces (e.g. bars) |
| Free Flowing | flow is contained within the contemporary active channel and is not obstructed by a channel spanning structural element (e.g., beaver dam or log jam) |
| Unit Type | Description |
|---|---|
| High | Feature, infrastructure, or land use at highest risk from being negatively affected by LTPBR actions. |
| Medium | Feature, infrastructure, or land use at modest risk from being negatively affected by LTPBR actions. |
| Low | Feature, infrastructure, or land use at lowest risk from being negatively affected by LTPBR actions. |
| Type | Description |
|---|---|
| Dam | single structural element, created by beaver or as a restoration structure, that functions like a beaver dam |
| Dam Complex | a collection of dams that are being mapped as a single point or polygon |
| Jam | a single aggregate of multiple woody debris pieces, or a single large piece of woody debris |
| Jam Complex | a collection of jams identified by a single point or polygon feature |
| Root Mass | the structural element is formed by a mass of rhizomatous roots or vegetation |
| Other Structural Elements | used for other structural element types, natural or constructed, that might occur within your riverscape |
| Type | Description |
|---|---|
| Riparian | species native to the riparian zone or wetlands. Typical riparian spp. include sedges, rushes, willow, cottonwood, alder, etc. |
| Non-Riparian | species not native to the riparian zone or wetlands. Typical non-riparian spp. include sagebrush, juniper, pine, fir, etc. |
| Type 2 Tier | Description |
|---|---|
| Emergent Riparian | herbaceous, non-woody vegetation such as forbs, ferns, graminoids, and grasses |
| Woody Riparian | non-herbaceous, woody vegetation such as deciduous trees, evergreen trees, shrubs, and saplings |
| BRAT Suitability | Description |
|---|---|
| 0-Unsuitable | Barren or dominated by species assemblages that are unpalatable to beaver as forage and unsuitable for use as building material. |
| 1-Barely Suitable | Generally upland dominated or barren areas with little suitable herbaceous or woody building material present. |
| 2-Moderately Suitable | Preferred deciduous species are less abundant, and the plant assemblage consists of upland and grassland species. Other suitable building material such as sagebrush are present. |
| 3-Suitable | Areas where preferred species are less abundant but other suitable building and forage are present including cattails and herbaceous riparian and wetland plants. |
| 4-Preferred | Areas with vegetative cover dominated by preferred forage and dam building species i.e., willow, aspen, alder, cottonwood and other deciduous riparian species. |
Metric Attributes
All metrics in LTPBR V2 DCE are calculated within the sample frames polygon layer. Any digitized features outside of the sample frame polygon will not be calculated within QRiS. Furthermore, all density and ratio metrics are normalized by either the valley bottom area, valley bottom length, or channel area.
- Channel Metrics
- Channel Junction Metrics
- Cluer & Thorne Metrics
- Geomorphic Metrics
- Inundation Metrics
- Structure Metrics
- Valley Bottom Metrics
| Metric | Description | Calculation |
|---|---|---|
| Channel Length | Sum of all primary and non-primary channel lengths | Sum(Primary Channel Length + Non-Primary Channel Length(s)) |
| Channel Sinuosity | Sinuosity of the primary channel | Sinuosity(Primary Channel) |
| Primary Channel Length | Sum of primary channel length | Sum(Primary Channel Length) |
| Relative Flow Length | Sum of all channel lengths per unit length of riverscape | Sum[Primary Channel Length + Non-Primary Channel Length(s)] / Valley Bottom Length |
| Secondary Channel Length | Sum of non-primary channel length(s) | Sum(Non-Primary Channel Length(s)) |
| Metric | Description | Calculation |
|---|---|---|
| Confluence Count | Count of all confluences | Count(Confluences) |
| Confluence Density | Number of confluences per unit length of riverscape | Count(Confluences) / Valley Bottom Length |
| Diffluence Count | Count of all diffluencecs | Count(Diffluences) |
| Diffluence Density | Number of diffluences per unit length of riverscape | Count(Diffluences) / Valley Bottom Length |
| Floodplain Channel Head Count | Count of all channel heads | Count(Channel Heads) |
| Floodplain Channel Head Density | Number of channel heads per unit length of riverscape | Count(Channel Heads) / Valley Bottom Length |
| Metric | Description | Calculation |
|---|---|---|
| Stage 0 Area | Summed area of all Stage 0 polygons | Sum[Stage 0 Area] |
| Stage 1 Area | Summed area of all Stage 1 polygons | Sum[Stage 1 Area] |
| Stage 2 Area | Summed area of all Stage 2 polygons | Sum[Stage 2 Area] |
| Stage 3 Area | Summed area of all Stage 3 polygons | Sum[Stage 3 Area] |
| Stage 4 Area | Summed area of all Stage 4 polygons | Sum[Stage 4 Area] |
| Stage 5 Area | Summed area of all Stage 5 polygons | Sum[Stage 5 Area] |
| Stage 6 Area | Summed area of all Stage 6 polygons | Sum[Stage 6 Area] |
| Stage 7 Area | Summed area of all Stage 7 polygons | Sum[Stage 7 Area] |
| Stage 8 Area | Summed area of all Stage 8 polygons | Sum[Stage 8 Area] |
| Metric | Description | Calculation |
|---|---|---|
| Mid Channel Area | Summed area of all mid channel bars | Sum[Mid Channel Bar Area] |
| Mid Channel Bar Count | Count of all mid channel bars | Count(Mid Channel Bars) |
| Mid Channel Bar Density | Number of mid channel bars per unit length of riverscape | Count(Mid Channel Bars) / Valley Bottom Length |
| Pool Area | Summed area of all pools | Sum[Pool Area] |
| Pool Count | Count of all pools | Count(Pools) |
| Pool Density | Number of pools per unit length of riverscape | Count(Pools) / Valley Bottom Length |
| Riffle Area | Summed area of all riffles | Sum[Riffle Area] |
| Riffle Count | Count of all riffles | Count(Riffles) |
| Riffle Density | Number of riffles per unit length of riverscape | Count(Riffles) / Valley Bottom Length |
| Metric | Description | Calculation |
|---|---|---|
| Free Flowing Area | Summed area of active channel classified as free flowing | Sum[Free Flowing Area] |
| % Free Flowing | Percent of active channel classified as free-flowing | Sum[Free Flowing Area] / Total Inundation Area |
| Overflow Area | Summed area of active channel classified as overflow | Sum[Overflow Area] |
| % Overflow | Percent of active channel classified as overflow | Sum[Overflow Area] / Total Inundation Area |
| Ponded Area | Summed area of active channel classified as ponded | Sum[Ponded Area] |
| % Ponded | Percent of active channel classified as ponded | Sum[Ponded Area] / Total Inundation Area |
| Metric | Description | Calculation |
|---|---|---|
| Dam Count | Count of all dams | Count[Dam(Points)] + Count[Dam(Lines)] |
| Dam Density | Number of dams per unit length of riverscape | Count[Dam(Points)] + Count[Dam(Lines)] / Valley Bottom Length |
| Jam Area | Summed area of jams | Sum[Jam(Polygons) Area] |
| Jam Count | Count of all jams | Count[Jam(Points)] + Count[Jam(Polygons)] |
| Jam Density | Number of jams per unit length of riverscape | Count[Jam(Points)] + Count[Jam(Polygons)] / Valley Bottom Length |
| Metric | Description | Calculation |
|---|---|---|
| % Inundated | Percent of valley bottom inundated by active channel(s) | Active Channel Area / Valley Bottom Area |
| % Riparian Vegetation | Percent of valley bottom covered by riparian vegetation | Riparian Vegetation Area / Valley Bottom Area |
| Proportion of Active Valley Bottom | Percent of valley bottom classified as 'active' (e.g., riparian vegetation, active channel, etc) | Active Valley Bottom Area / Valley Bottom Area |
| Percent Recovery Space | Percent of valley bottom that is avaiable for restoration or recovery of aquatic/riparian processes | Recovery Space Area / Valley Bottom Area |
Resources
Weber et al. 2024
Low-Tech Process-Based Restoration Design and Monitoring Protocol: Standard Methods for Developing Project Designs and Assessing Riverscape Health
Bartelt et al. 2021
Valley bottom inundation patterns in beaver-modified streams: A potential proxy for hydrologic inefficiency
Cluer and Thorne. 2014
A Stream Evolution Model Integrating Habitat and Ecosystem Benefits