QRiS Workshop 1 - Getting Started in QRIS
This workshop will cover the essentials for getting a project started in QRIS. We be following a Desk Guide that is intended to be simple, straightforward and clearly outlined. However, more detailed help can be found in Software Help.
A downloadable dataset and Desk Guide can be accessed at the bottom of the page.
Initial Setup
We will install QGIS, QRiS, and Riverscapes Viewer, and set up your QGIS interface.
Install
QGIS Install
Download QGIS and follow the QGIS website’s directions to complete the installation. We recommend the current LTR release.
QRiS and Riverscapes Viewer Install
QRiS and Riverscapes Viewer are plugins to QGIS. You will download and install them directly in QGIS.
Open QGIS In the QGIS menubar at the top of the page, Plugins > Manage and Install Plugins.
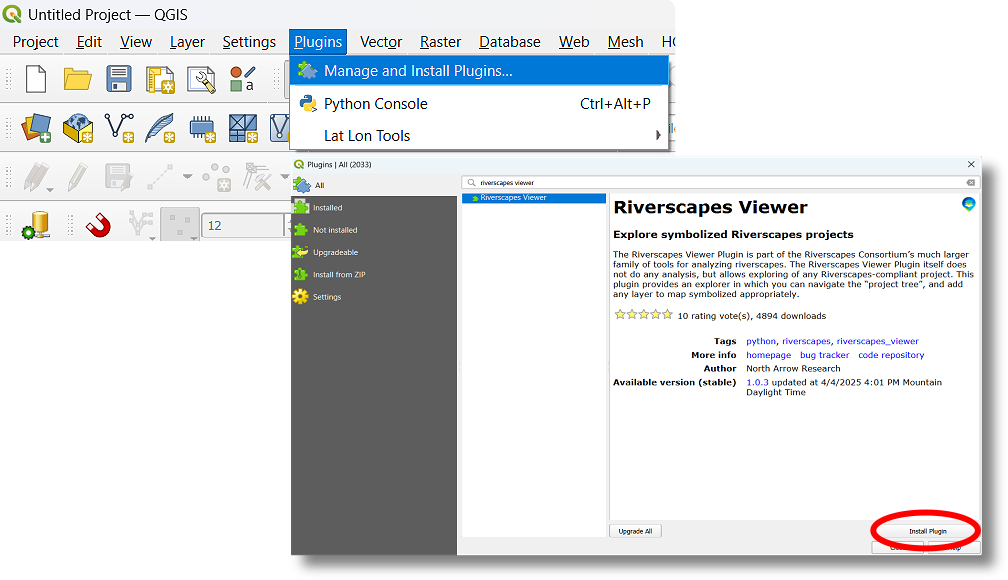
Install the Riverscapes Viewer plugin first. Search for Riverscapes Viewer and click the Install button. This is a required dependency for QRiS.
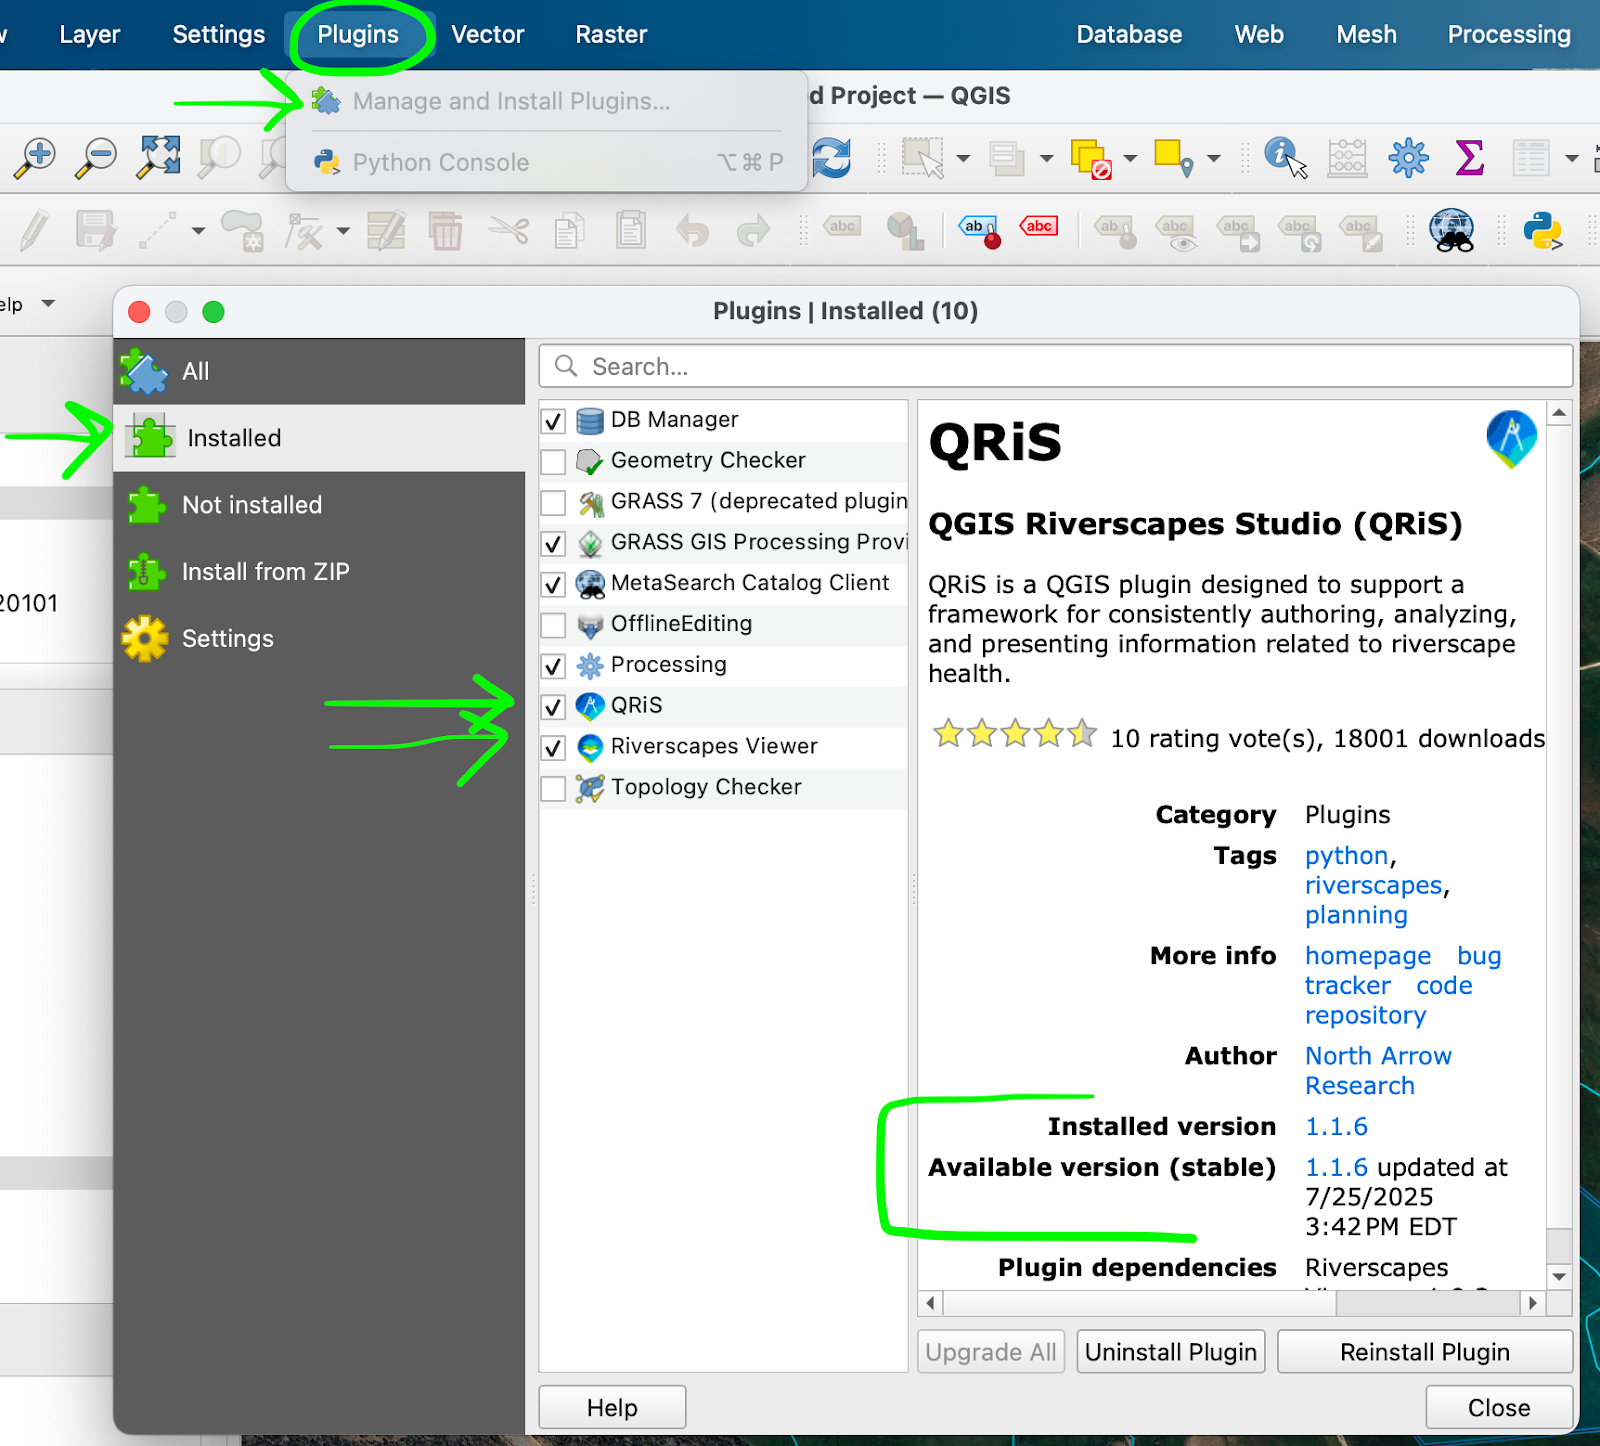
Install the QRiS plugin next. Follow the same steps to Plugins > Manage and Install Plugins and search for QRiS. Click the Install button.
Keeping QRiS and Riverscapes Viewer Updated
When you launch QGIS, check that your QRiS and Riverscapes Viewer plugins are up to date. From the top of page menubar > Plugins > Manage and Install Plugins > Installed > QRiS or Riverscapes Viewer > check that Installed version matches Available version. If not, that Upgrade All button will be available.
Demo Video
Getting Started in QRIS
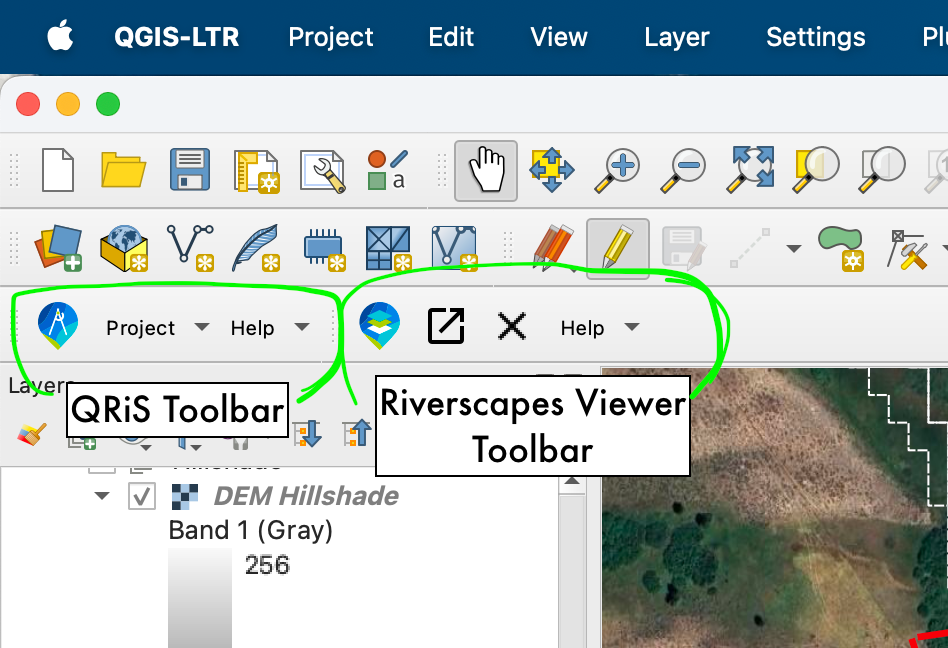
Finding the Riverscapes Viewer and QRiS Toolbars
When you open QGIS, click the Riverscapes Viewer and QRiS icons on their toolbars to launch the plugins. This will open a pane for the plugin.
Update Resources
QRIS relies on symbology stored in the riverscapes viewer. Changes to symbology are made periodically, so it is always good to make sure you are up to date.
In the Riverscapes Viewer toolbar click the arrow next to help, then click "Update Resources".
Note: This should be the first thing you do if layers are loading into your project without symbology.
Adding Toolbars
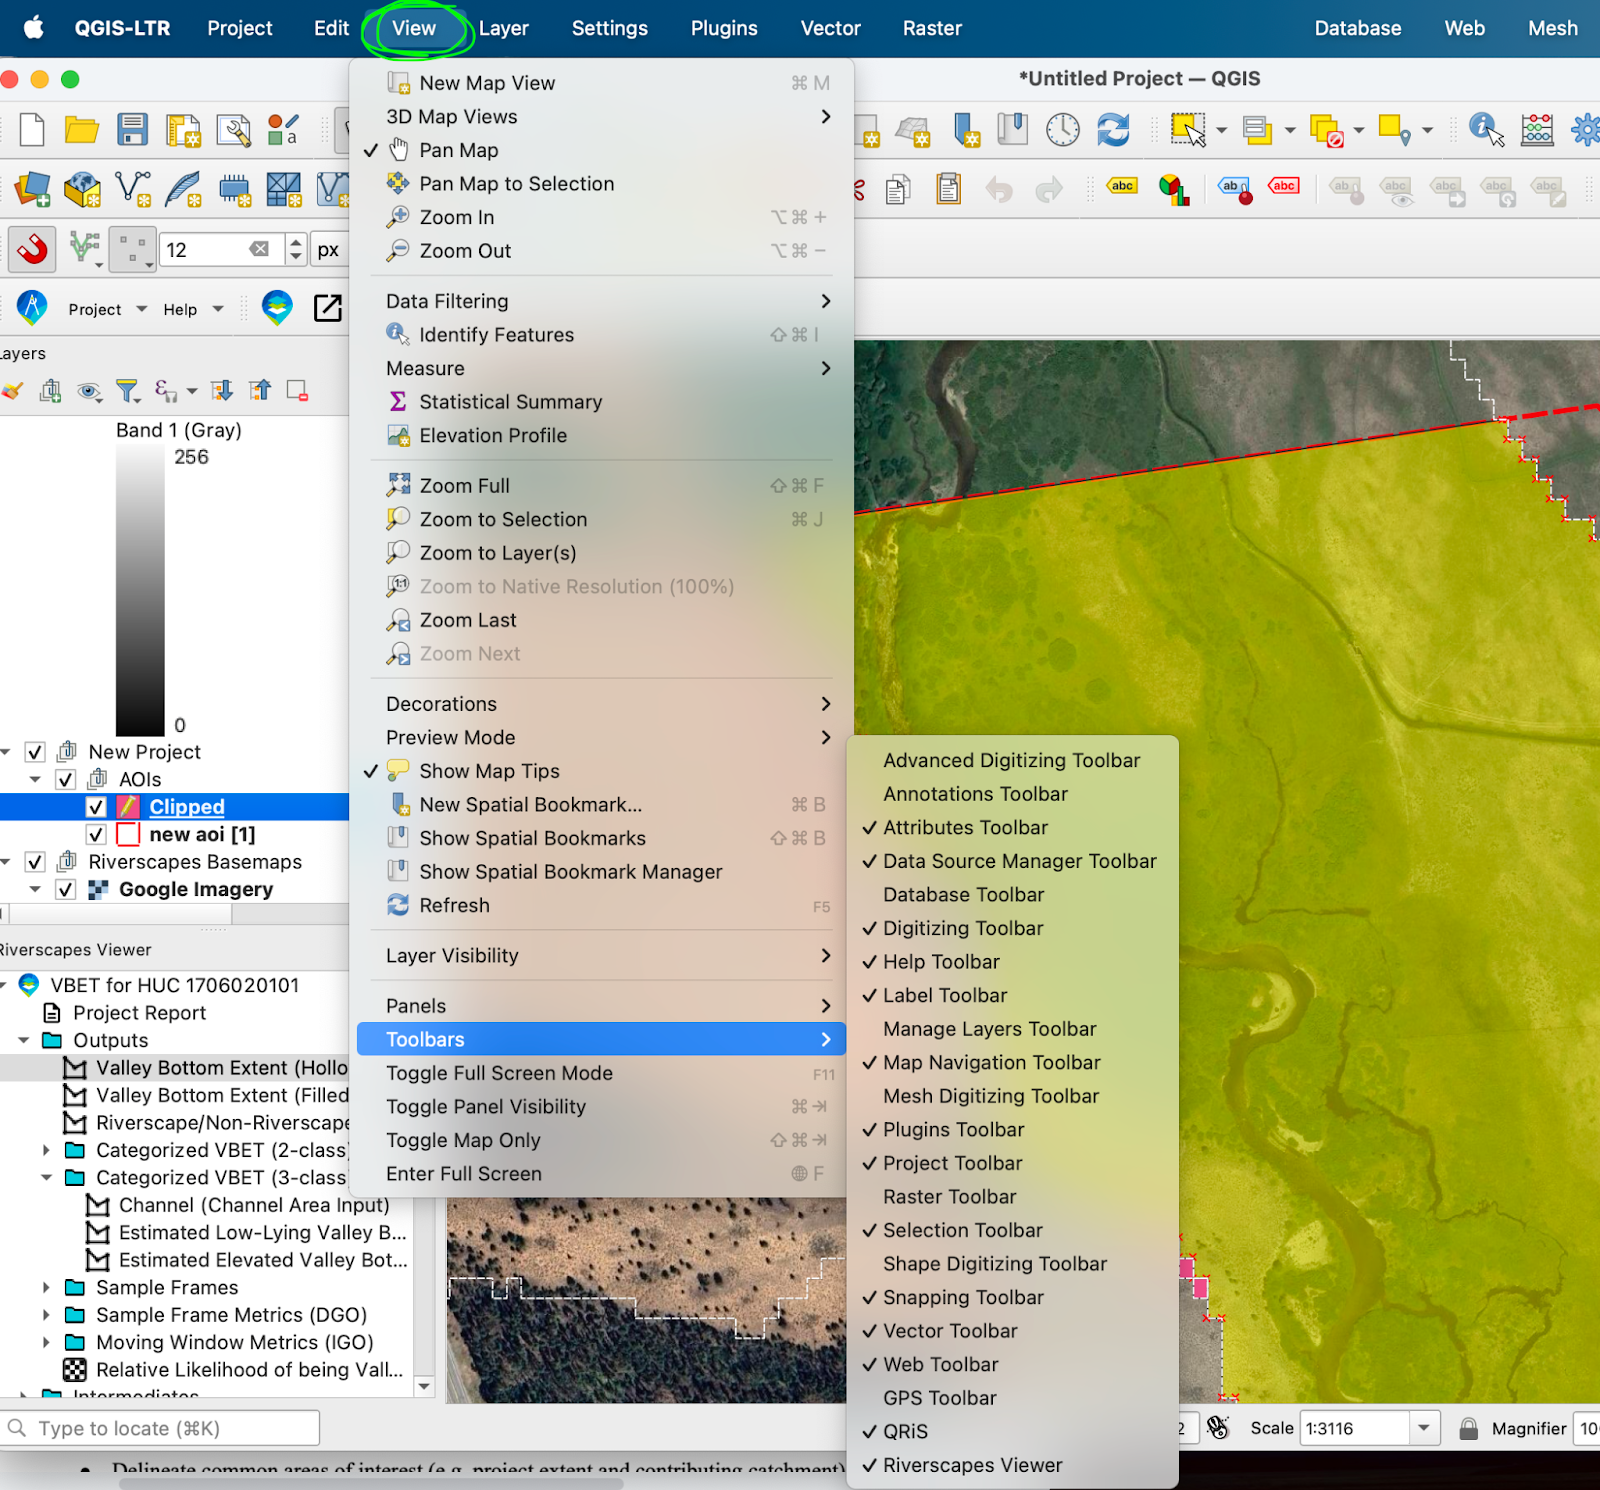
You’ll want to toggle the Advanced Digitizing, Digitizing, and Snapping toolbars on. In the top of page menubar, View > Toolbars
Add the Profile Plugin
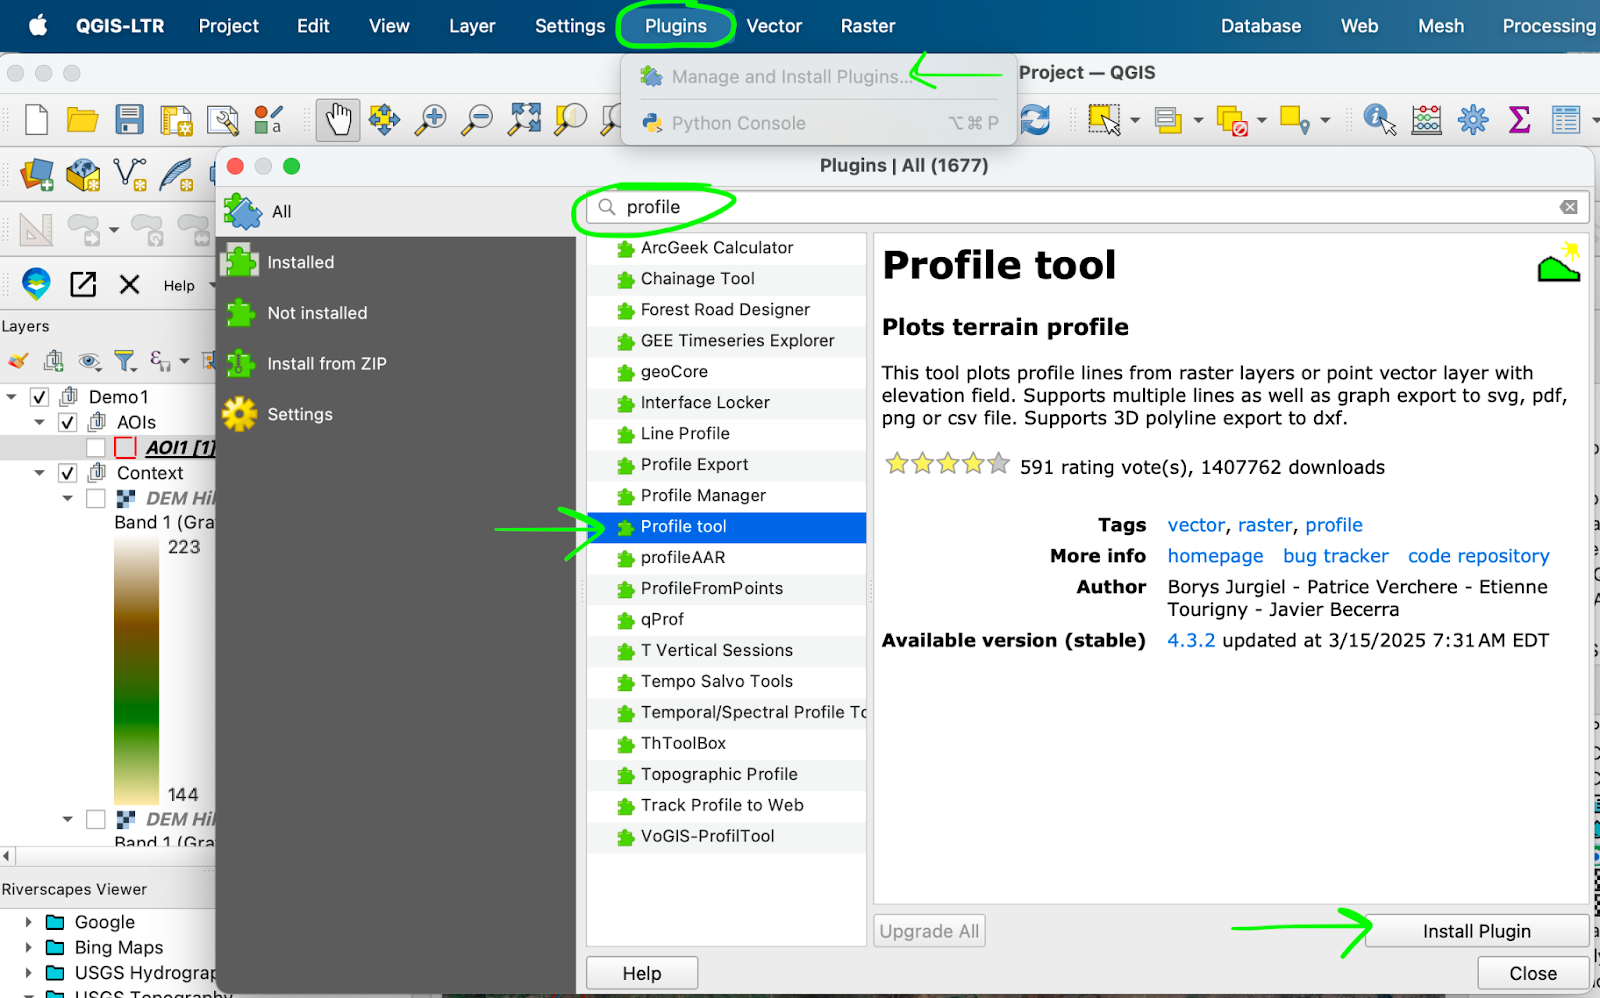
Add the Profile Tool as a plugin. From the top menubar > Plugins > Manage and Install Plugins… > Search for profile tool > Install plugin
Demo Video
Getting Started with a New project
In this section, we obtain, derive, and organize the core data inputs that users will need to evaluate, plan, and design a riverscape project efficiently and effectively. The objective is to produce and organize the foundational elements of a QRiS project that will help practitioners complete the subsequent steps. Specifically, we show you how to:
- Obtain, load, and view nationally available datasets to define and contextualize the (a) project area and (b) contributing catchment.
- Create a new QRiS project with empty containers that you will utilize to organize, display, and analyze data.
- Delineate common areas of interest (e.g. project extent and contributing catchment) to streamline subsequent mapping, data management, and analysis.
- Obtain and summarize catchment attributes that influence the character and behavior of the riverscape segments in which you are planning a project.
- Add high fidelity imagery, build pyramids to improve processing performance, and elevate as a surface in the QRiS project.
Create a New project
When you open QRiS, click the Riverscapes Viewer and QRiS icons on their toolbars to launch the plugins. Make sure they are up to date.
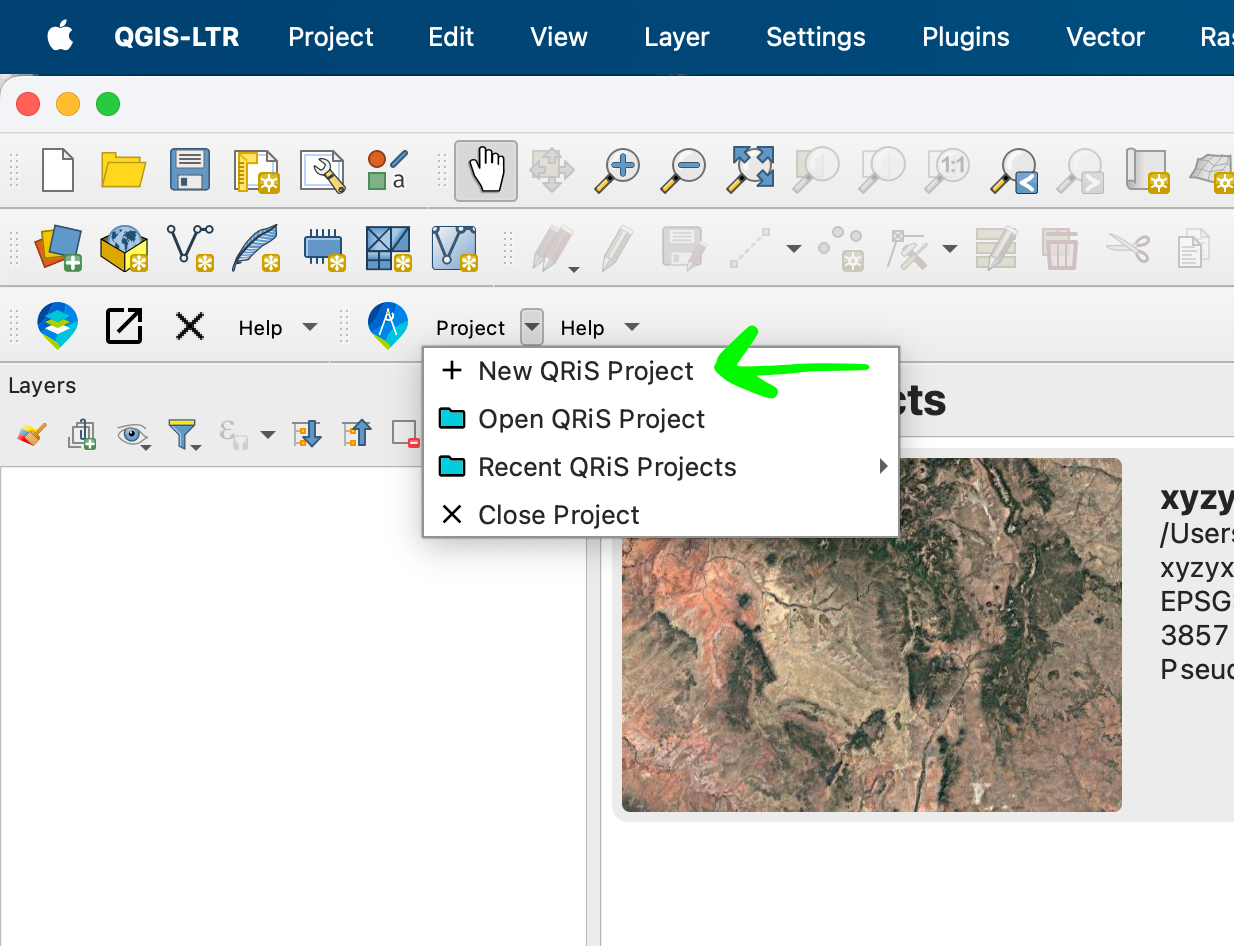
Start a new QRiS project. In the QRiS toolbar, use the dropdown menu next to Project > + New QRiS Project
A Google Imagery map will open. Zoom to the area on the map that you want to work.
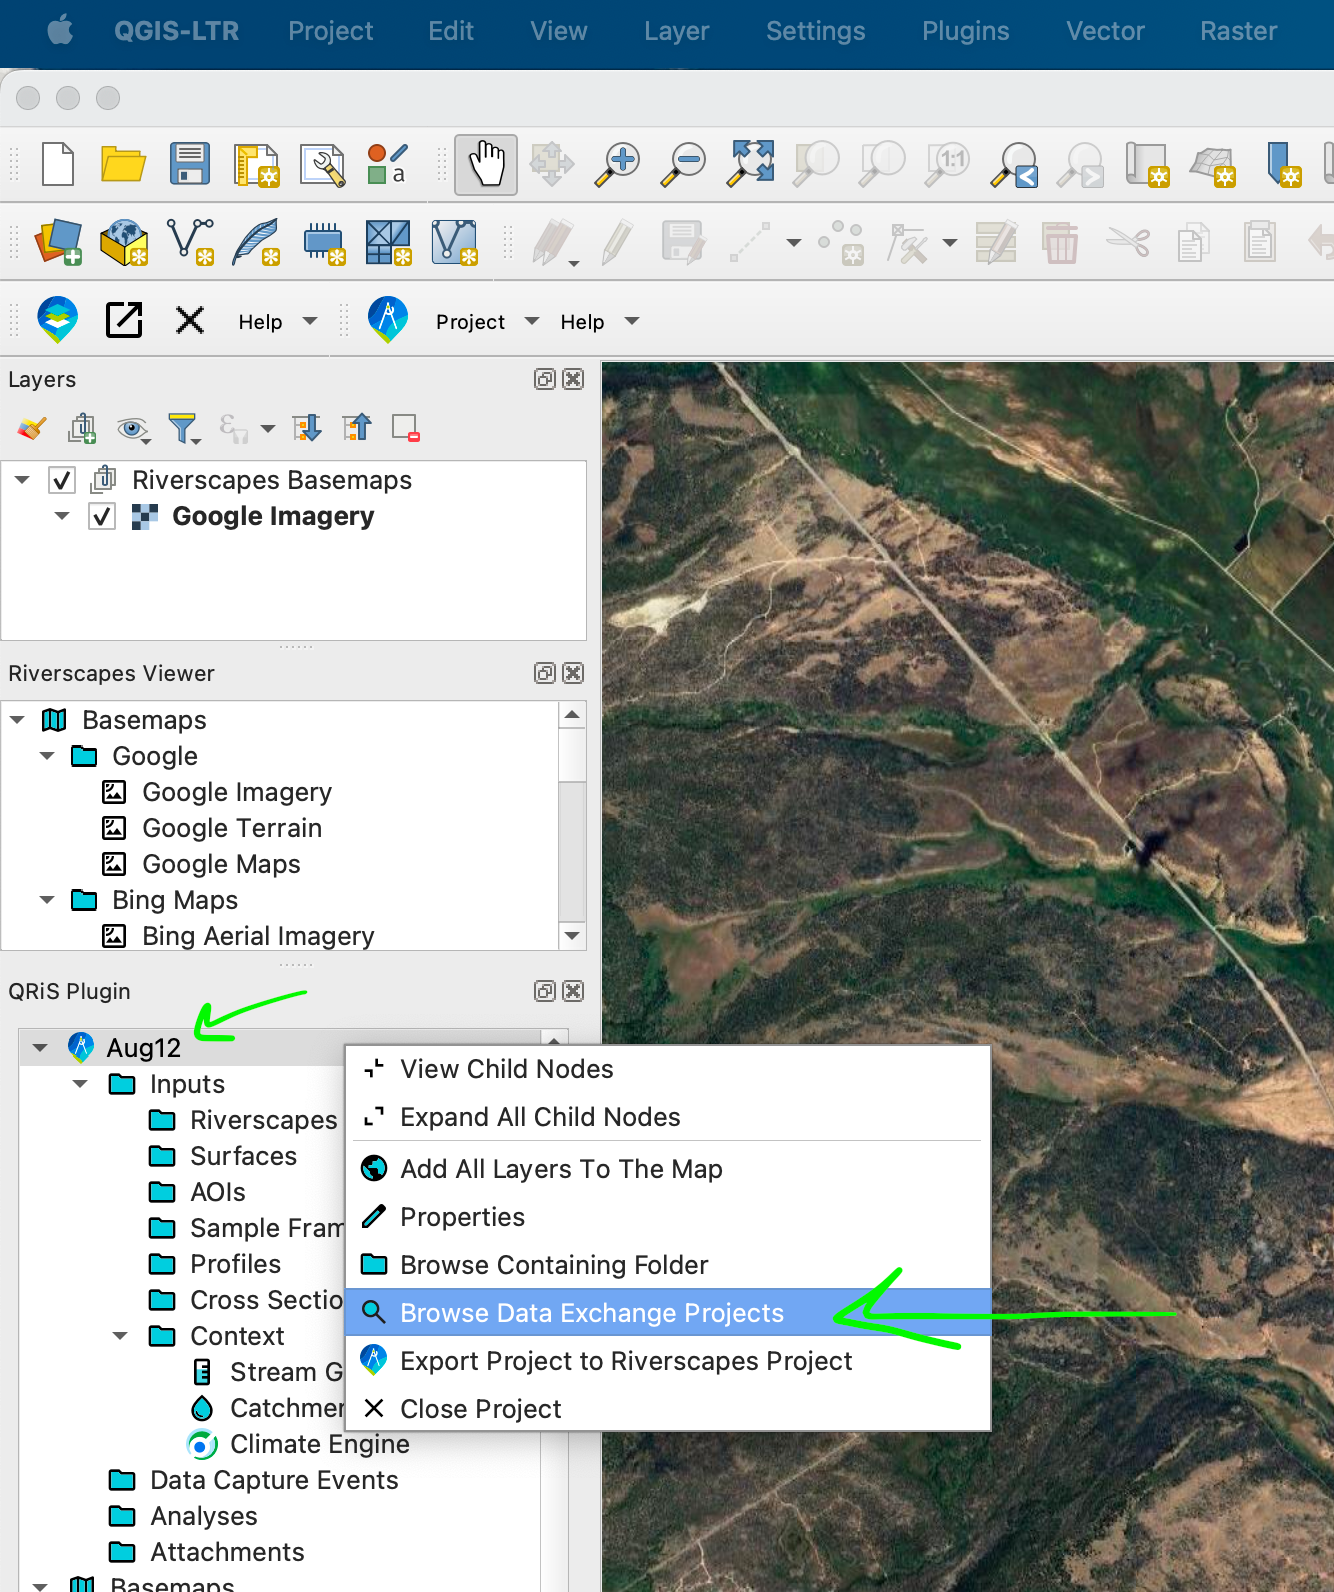
Under the QRiS Plugin pane, right click on your project name, and select Browse Data Exchange Projects. This will open a Data Exchange window in your web browser, zoomed to the map area open in QGIS.
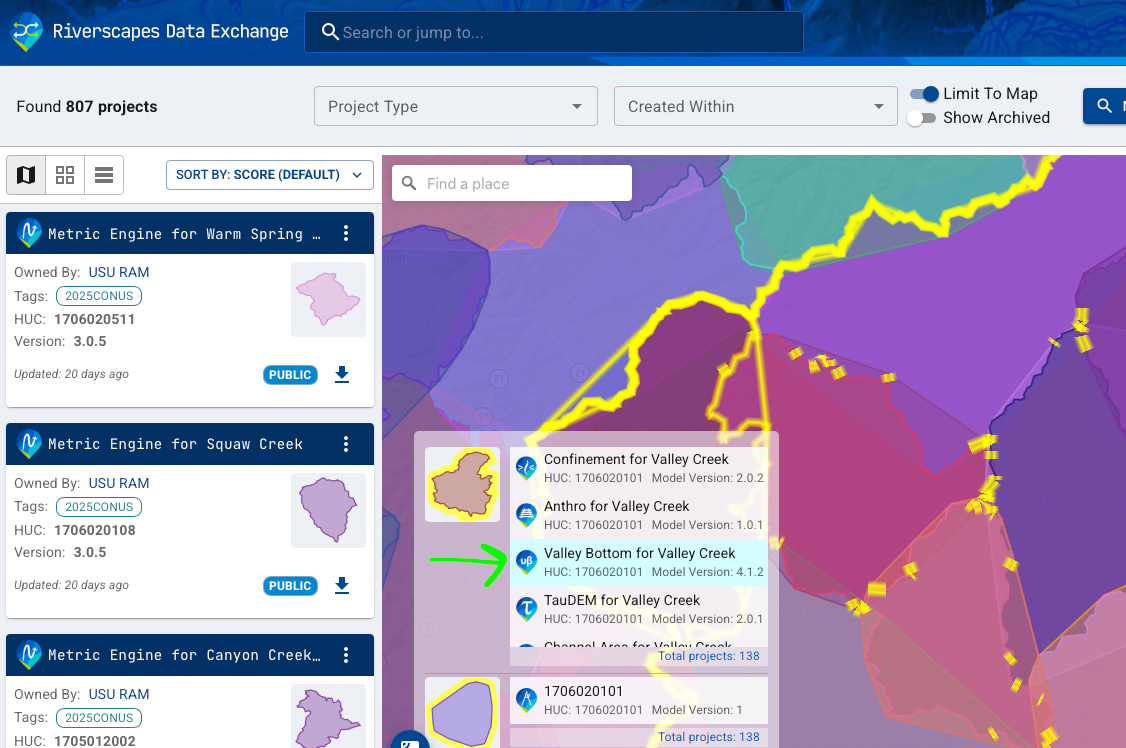
In the Data Exchange, you can zoom out as needed to be sure you select the HUC 10 you’re working within. Click your HUC 10 and find a Valley Bottom (VBET) project. Click the project. A banner at the top of the project page will alert you if there is a newer version of the Valley Bottom project run. Download your Valley Bottom project.
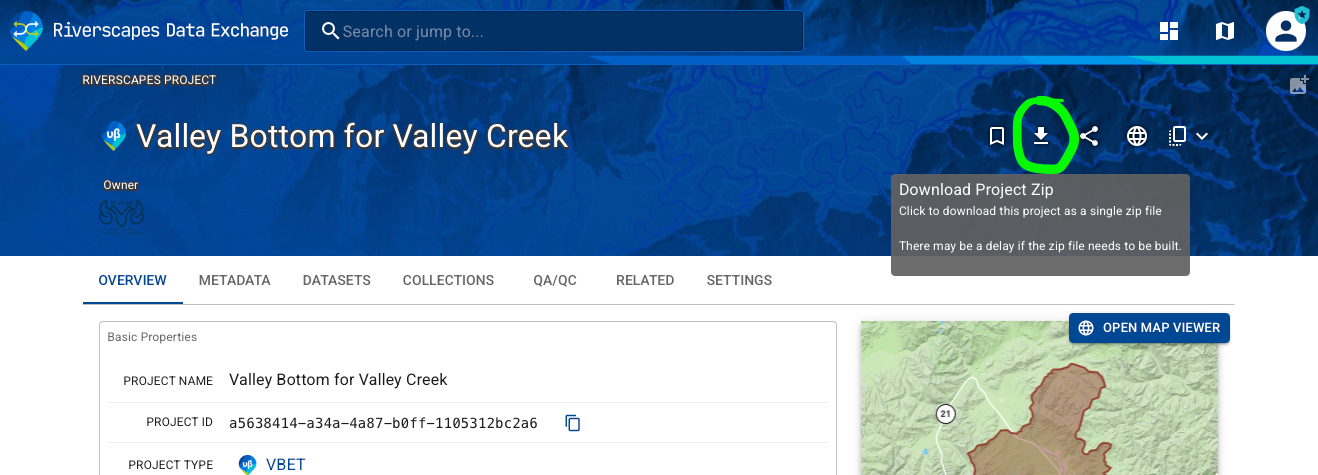
Follow the same steps to find and download the Riverscapes Context project as well.
Open Your Projects Downloaded from the Data Exchange
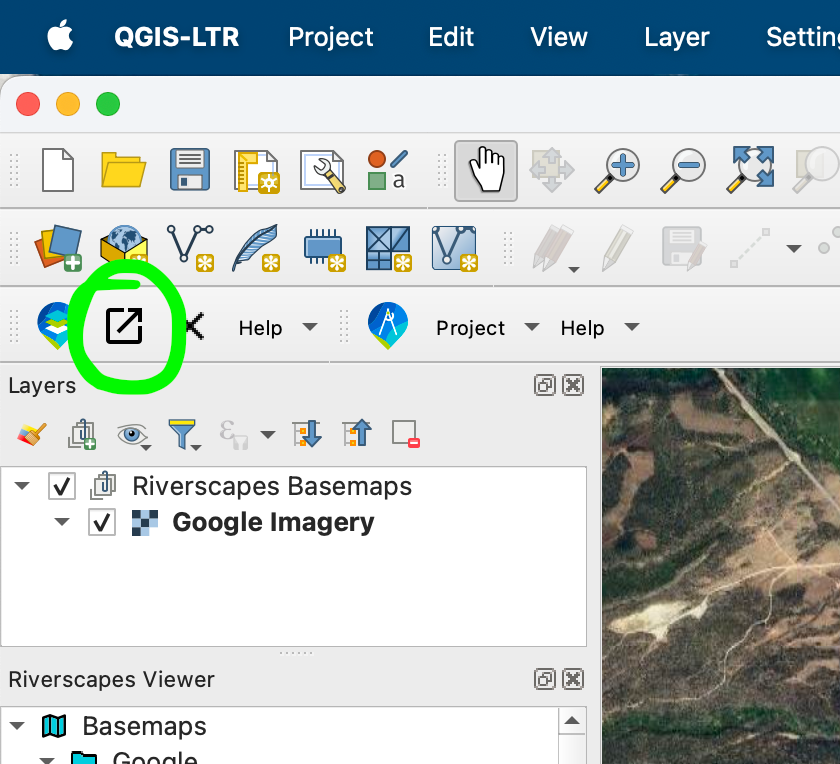
Return to QGIS. In the Riverscapes Viewer toolbar, open your projects with “Open Riverscapes Project”.
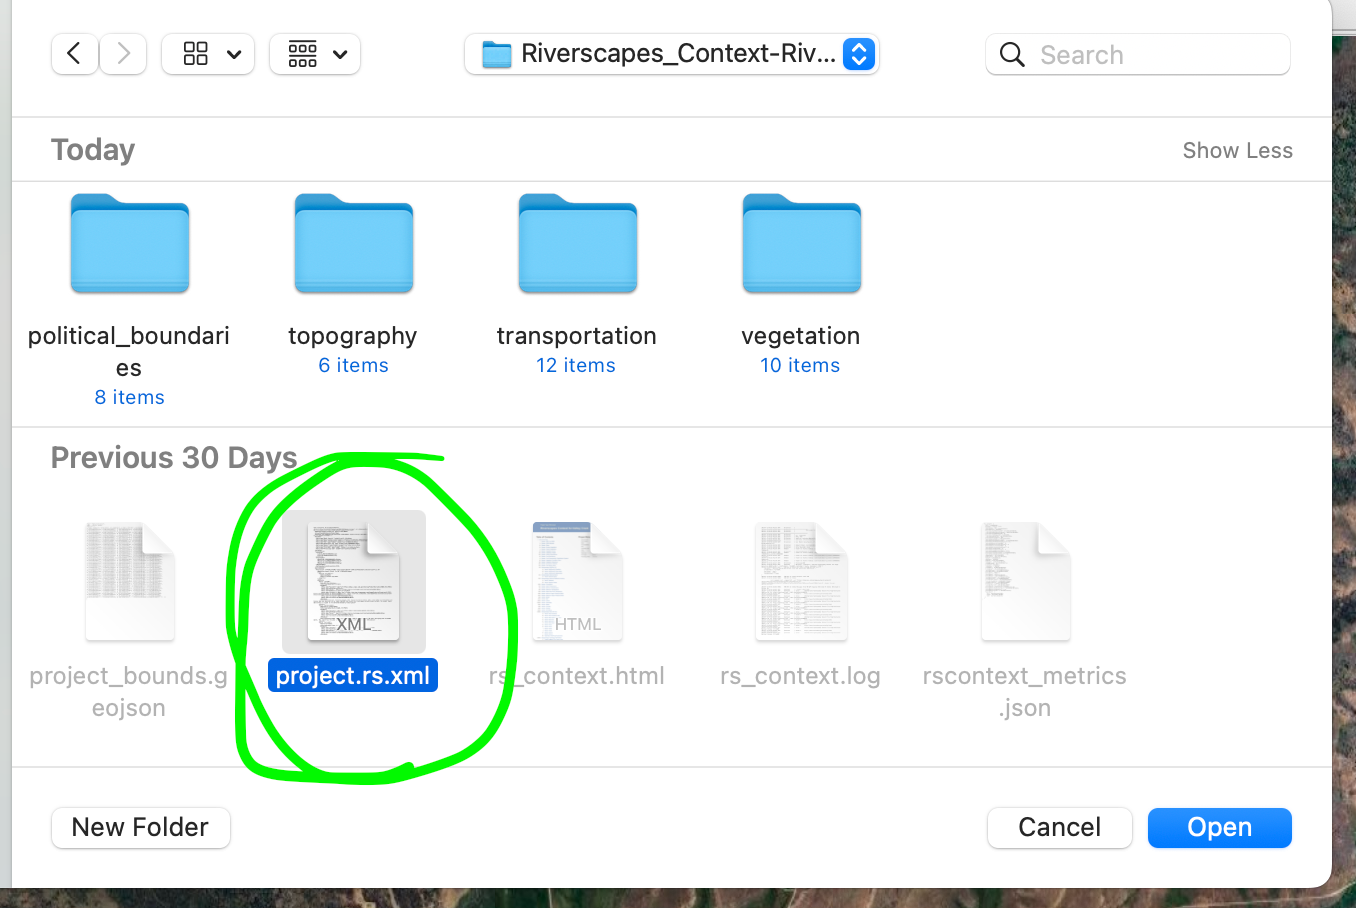
This opens navigation to the files on your computer. Find your recently downloaded projects. Find and open the project.rs.xml file.
Demo Video
Add Layers to the Map
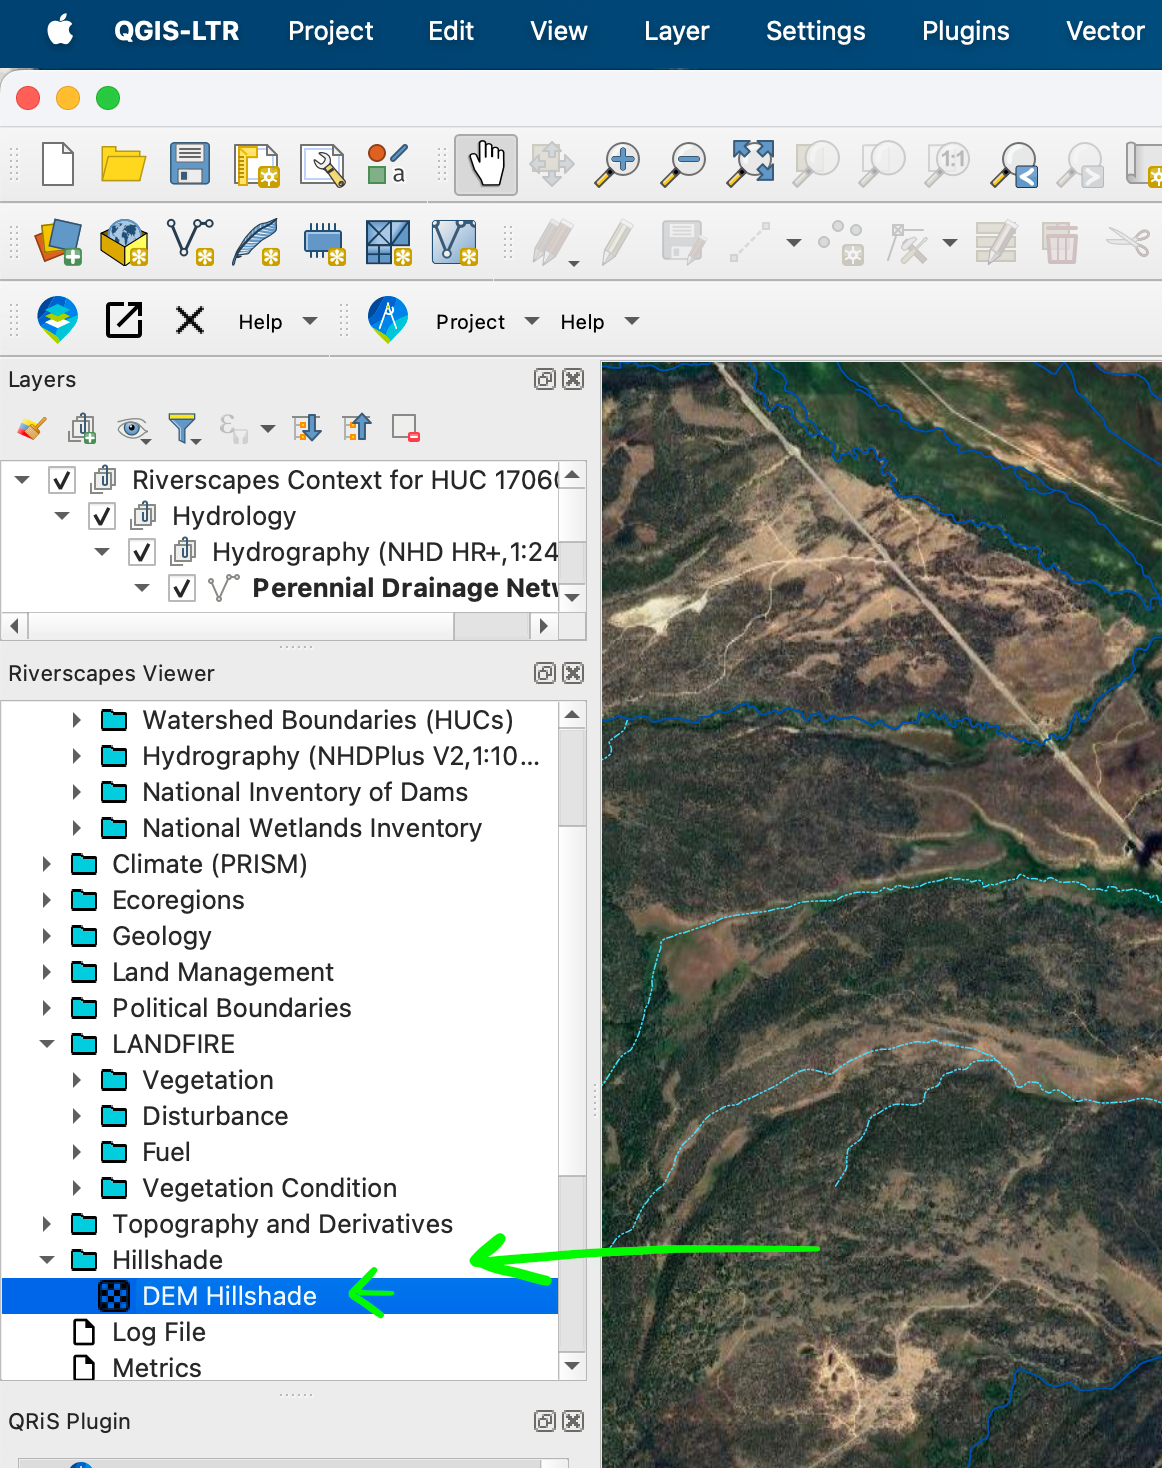
Within the Riverscapes Viewer pane, add the following layers to the map (double click to add a layer to the map):
Hillshade:
Ownership:
Delineate an Area of interest
Next, we’ll delineate an Area of Interest (AOI) based on your project’s extent. An AOI will help us clip and summarize contextual data for our project area and its contributing basin.
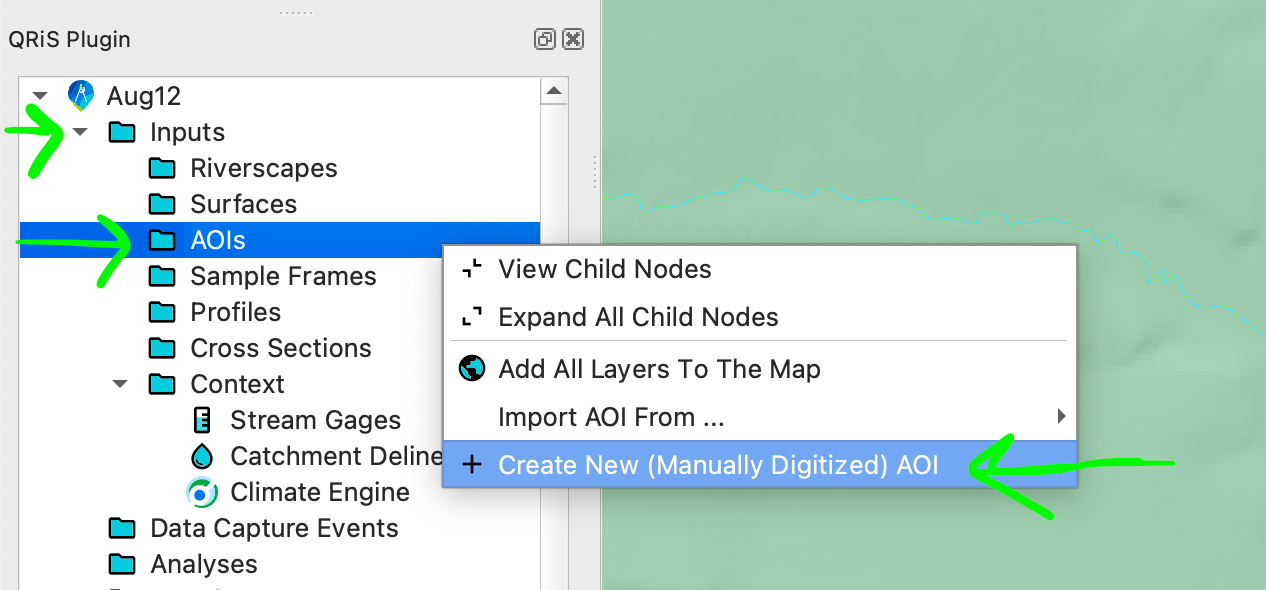
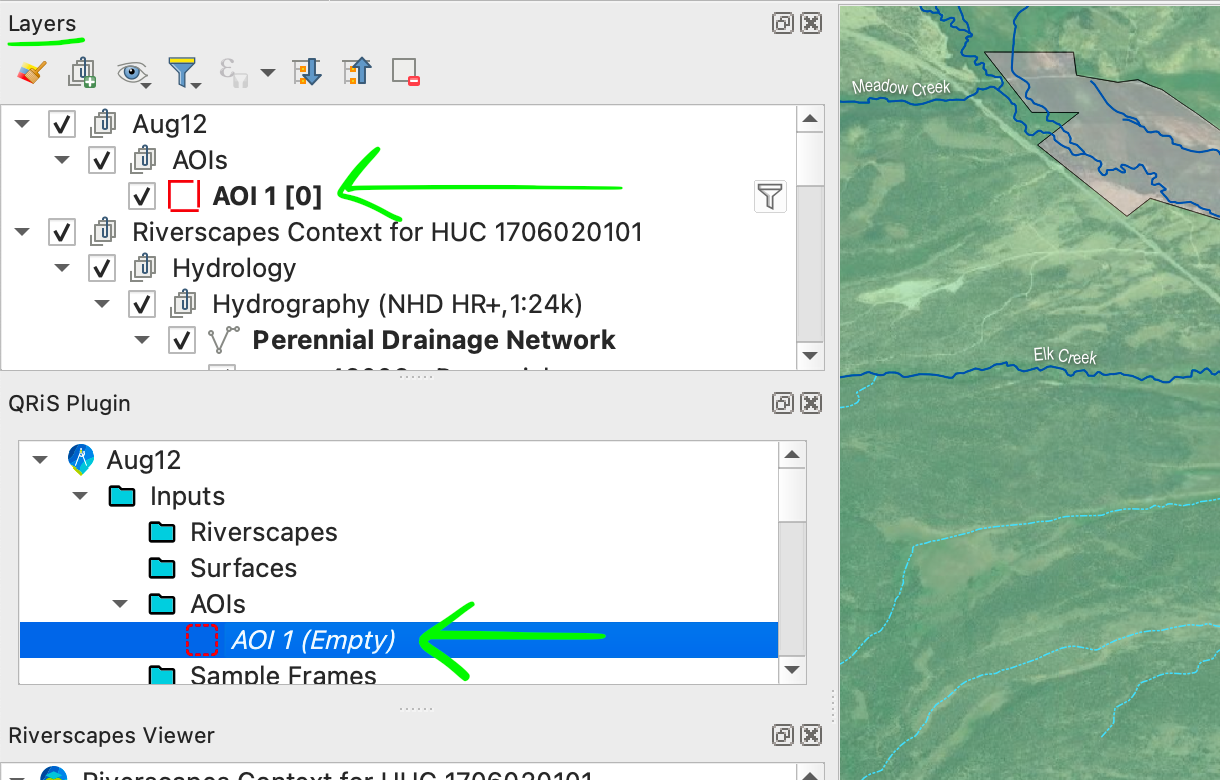
In the QRiS pane, under your project, Inputs > AOIs > right click AOIs > Create New (Manually Digitized) AOI. Give it a name (like AOI 1) and click OK.
Your AOI should show up in the Layers pane. (If not, double click on it in the QRiS pane to add it to the Layers pane.)
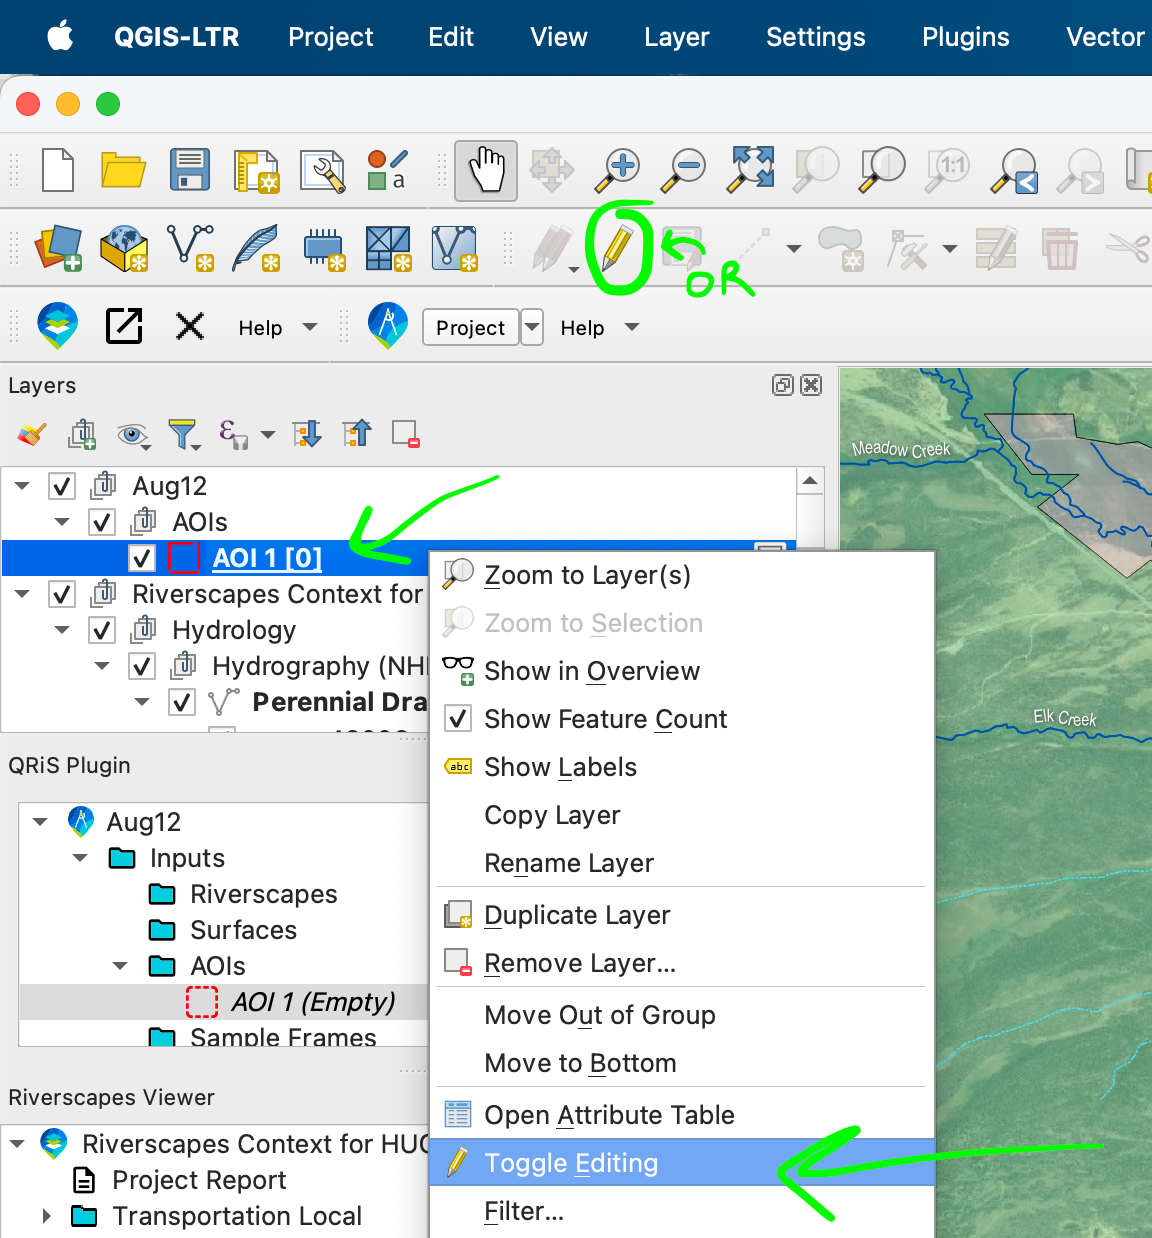
Map your project’s extent (your area of interest AOI) as a polygon. To do this, right click on your AOI in the Layers pane > Toggle Editing.
Hint: We will use the AOI to clip data, because we only want the data for our project’s scale. The AOI could be an entire watershed, or a 100m reach.
For our purposes, draw the project extent polygon far enough beyond the valley margin to include adjacent landscape features like fans, terraces, and hillslopes that abut the valley, valley bottom, and confining margins. In subsequent steps, you will use this AOI to clip contextual and surface data.
Click ‘Add Polygon Feature’.
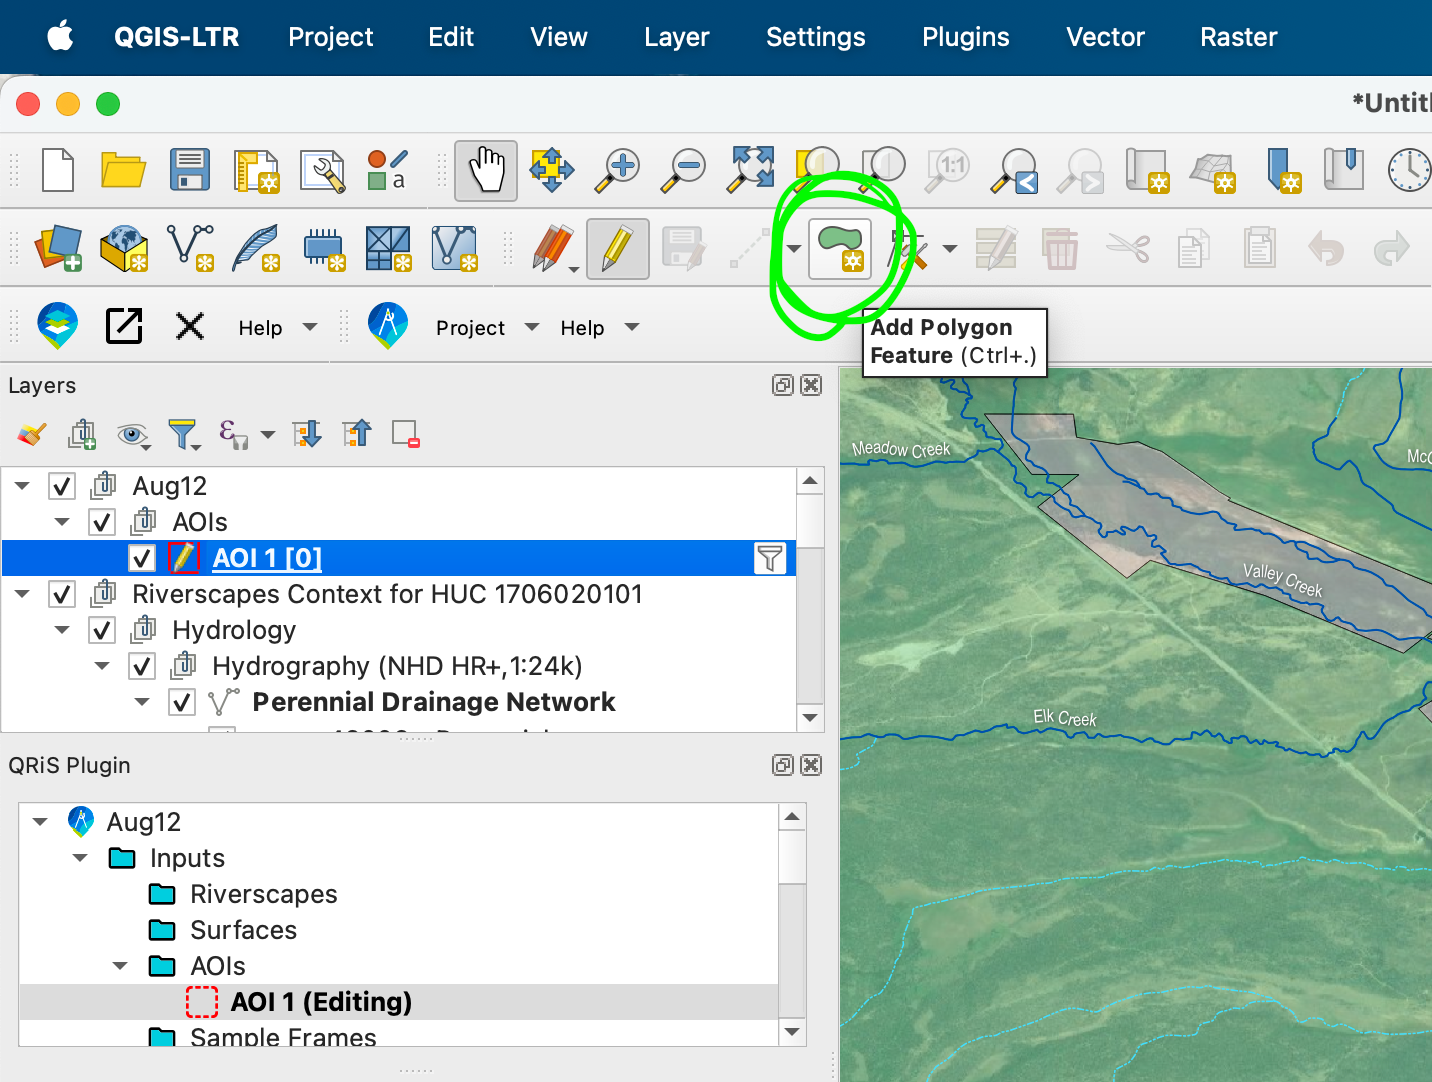
Click on the map to draw a polygon around your project’s extent.
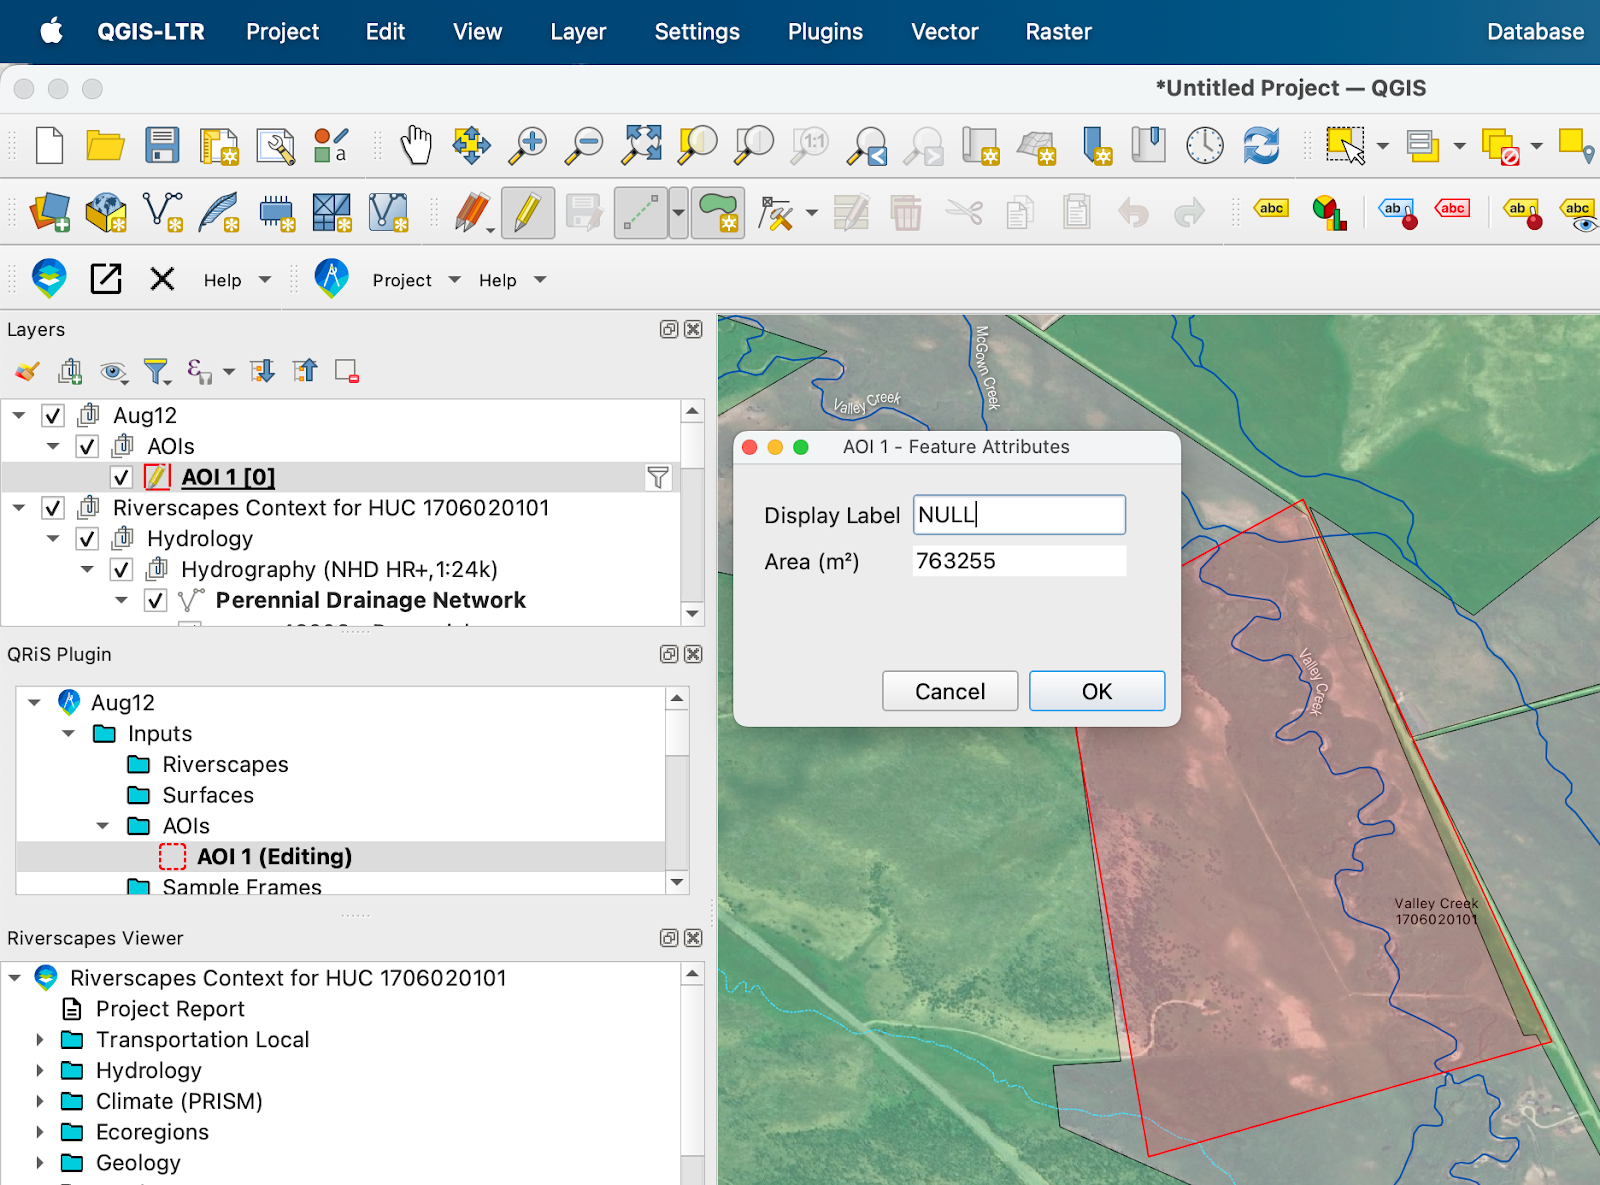
When you have captured your area, right click to lock it in. Just click OK on the pop up window
Hint: Draw the project extent polygon far enough beyond the valley margin to include adjacent landscape features like fans, terraces, and hillslopes that abut the valley, valley bottom, and confining margins. In subsequent steps, you will use this AOI to clip contextual and surface data.
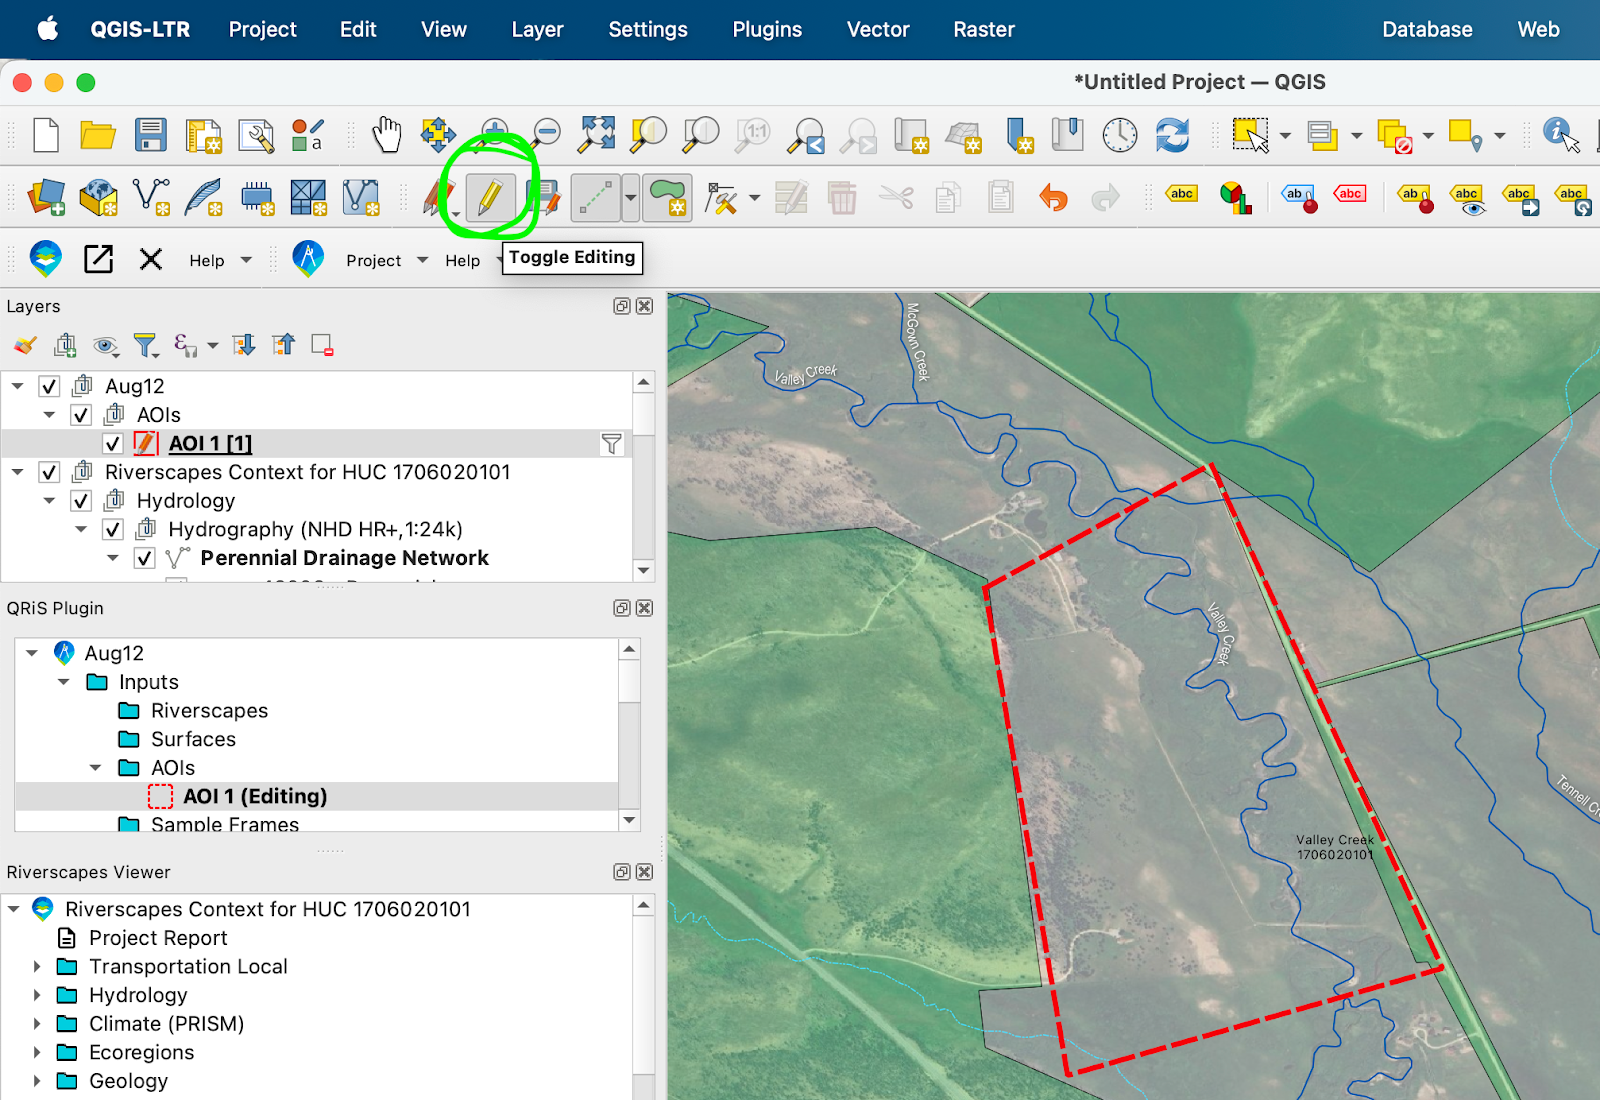
Click Toggle Editing to finalize your AOI. Click Save on the window that pops up.
Add Layers to the Project using AOI
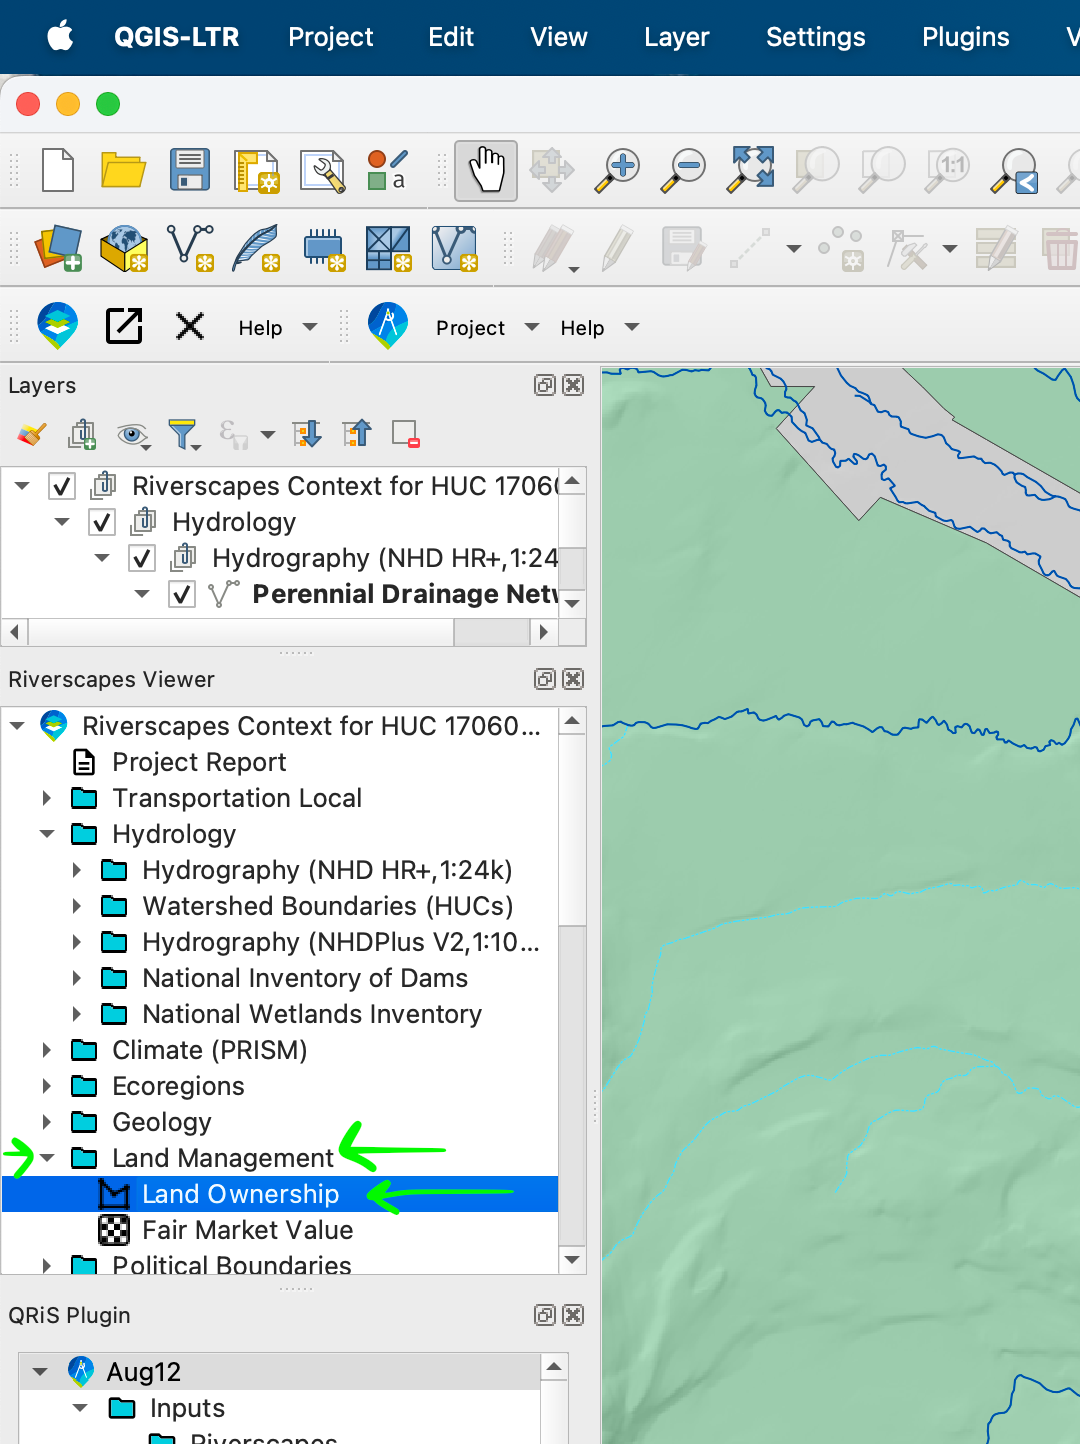
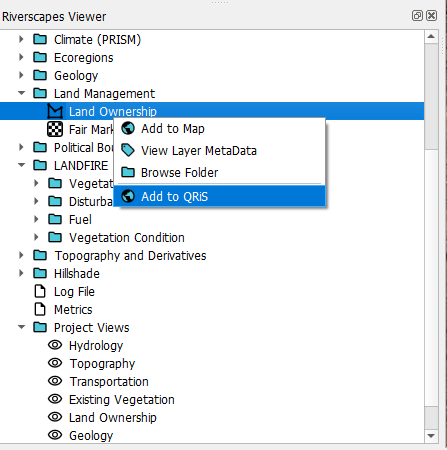
In the Riverscapes Viewer pane open the Land Management folder in the Riverscapes Context project. Right click on the Land Ownership Layer and click "Add to QRIS".
In the dialogue box that opens leave the name as Land Ownership and under "Clip to AOI" change the selection from "None - Retain full datset extent" to your AOI layer. Click OK.
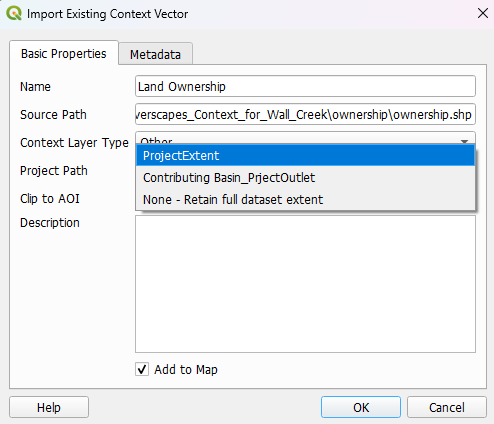
This will import a clipped copy of the data from the Riverscape Project into your QRIS project.
Repeat this process other desired layers from the Riverscapes Viewer projects.
Demo Video
Create a Contributing Catchment AOI
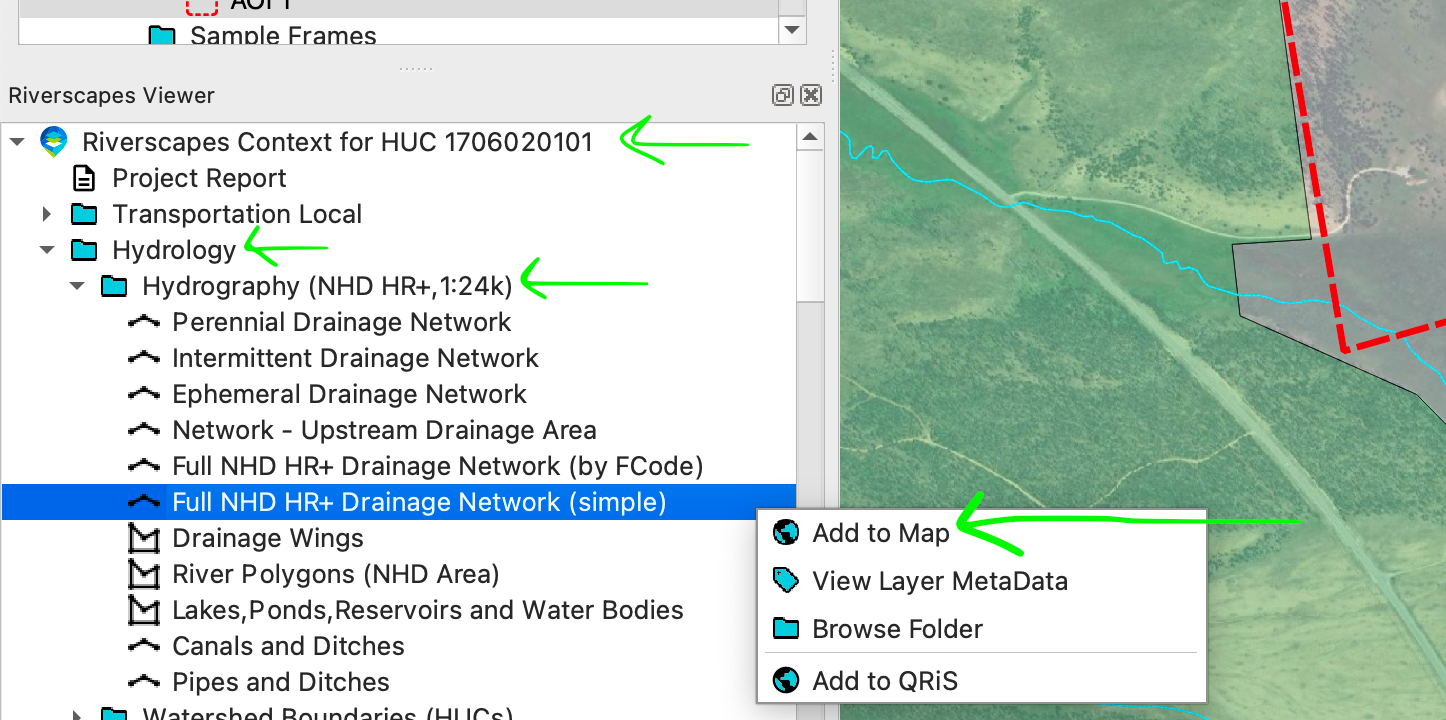
First, we’ll add the NHD Stream Network to the Layers pane. To do this, in the Riverscapes Viewer Pane > Riverscape Context Project > Hydrology > Hydrography > right click Full NHD HR+ Drainage Network (simple) and select Add to Map.
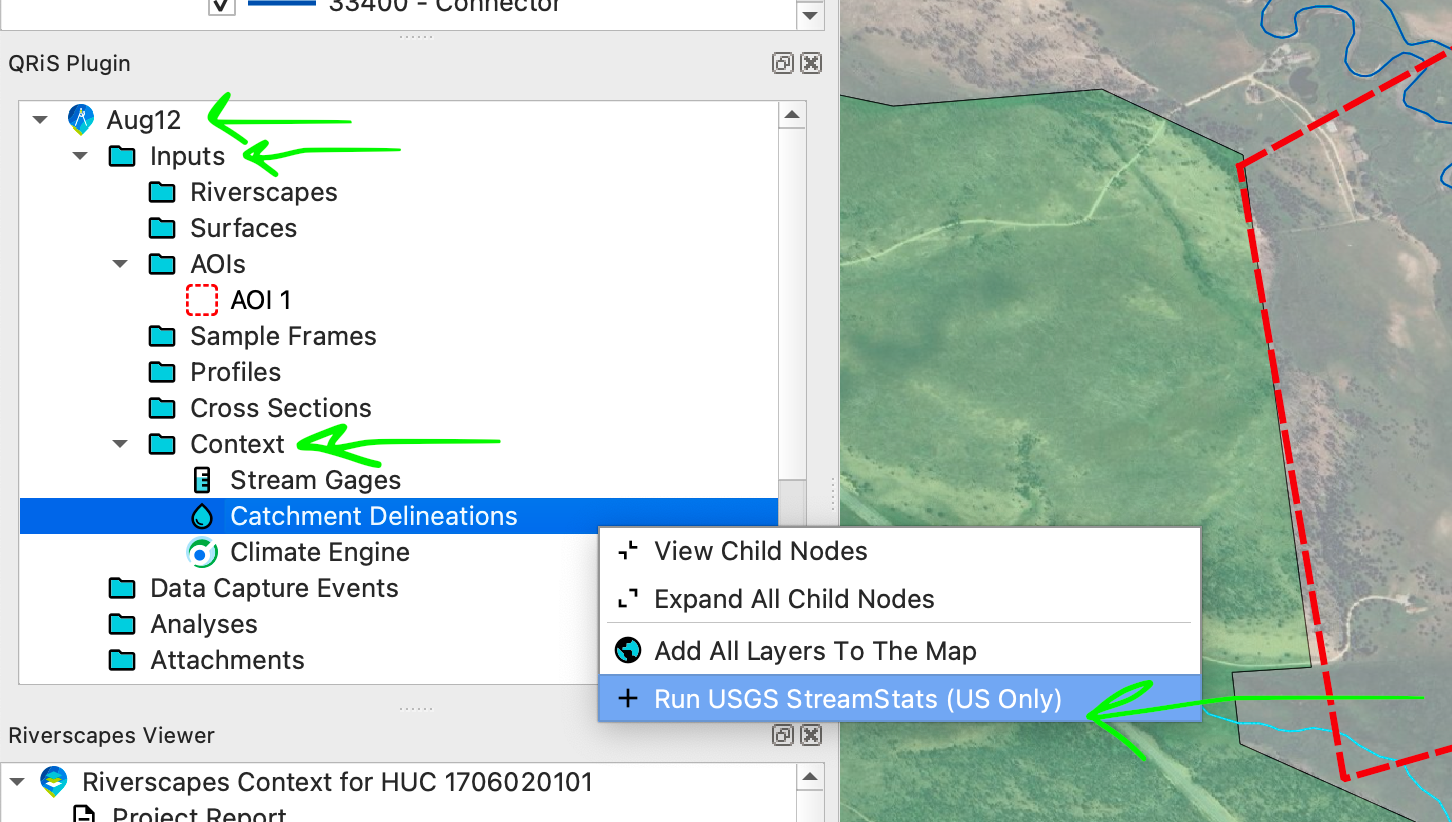
Next, we’ll delineate the Contributing Catchment. In the QRiS pane > Your QRiS Project > Inputs > Context > right click Catchment Delineations and select Run USGS StreamStats.
Read the ‘Pour Point Dialogue Box’ and select ‘OK’.
Zoom to the NHD stream pixels at the downstream end of your AOI polygon. It’s critical to zoom closely and select an NHD flowline pixel.
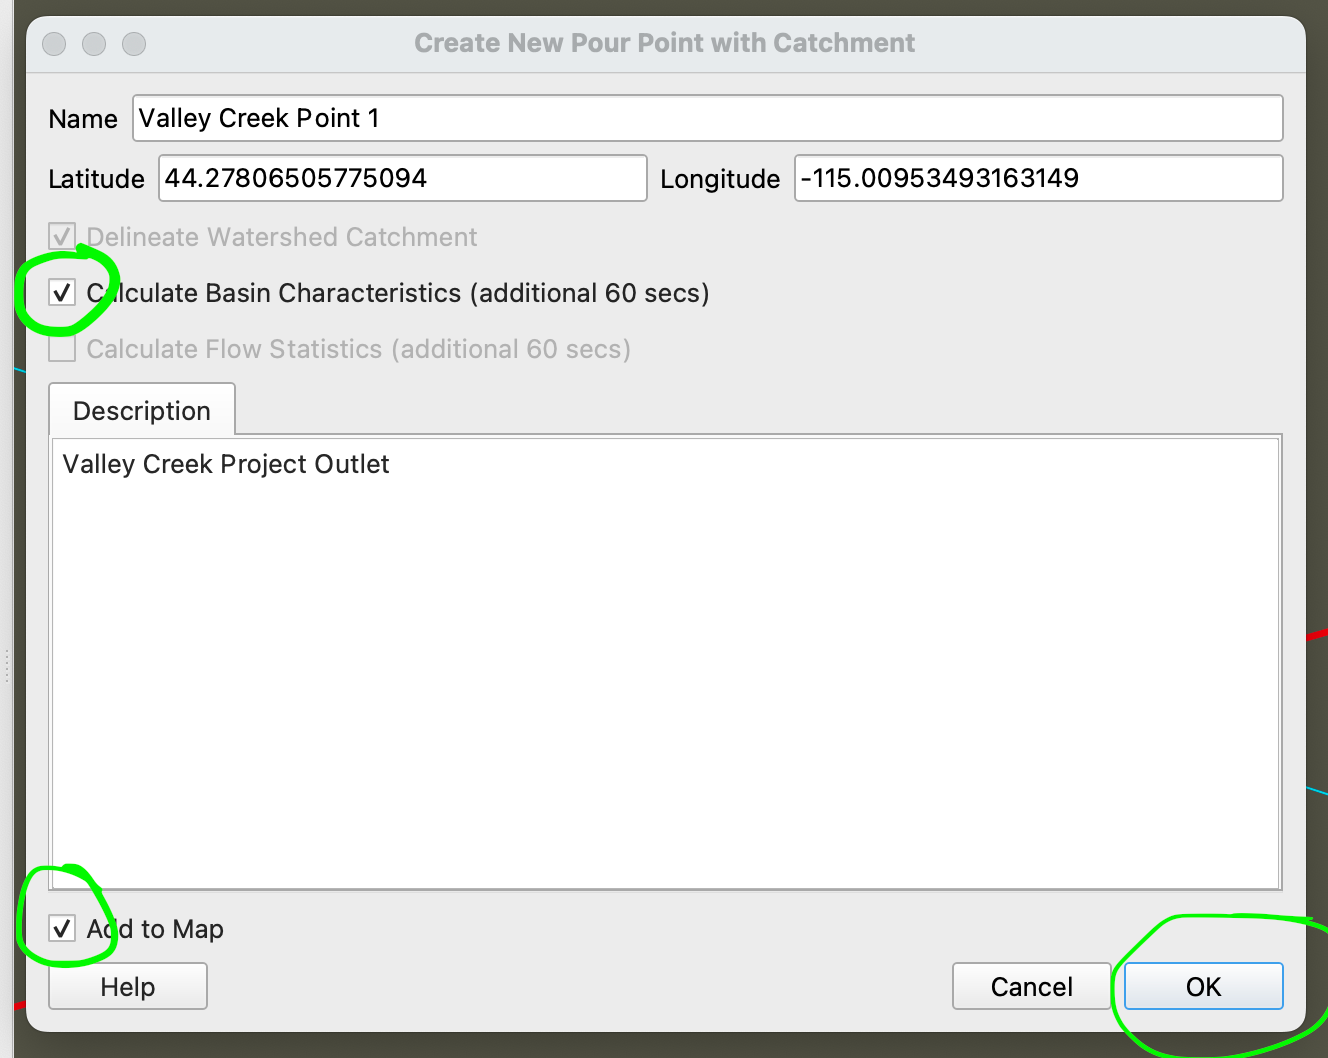
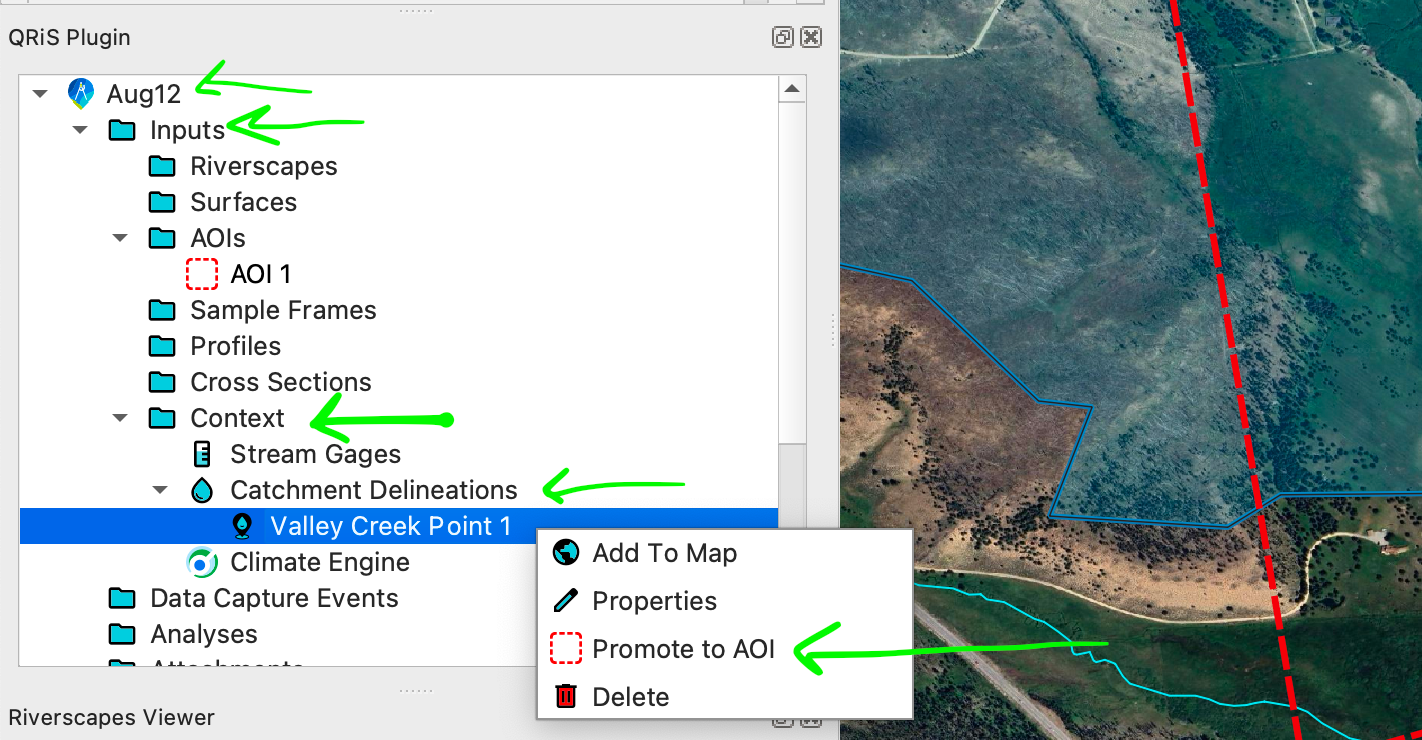
Click on a stream pixel to select it as the ‘Pour Point’. This opens the ‘Create New Pour Point with Catchment’ dialogue box. Add a descriptive name, like Valley Creek Point 1. Toggle on ‘Calculate Basin Characteristics’. Add a description to help others understand what this area represents, like Valley Creek Project Outlet. Keep ‘Add to Map’ toggled on. Click OK. It can take several minutes.
When complete, navigate to the new catchment polygon. In the QRiS pane > Your QRiS Project > Inputs > Context > Catchment Delineations > right click ‘Name of Your New Catchment’ and Promote to AOI.
Note: The delineation may not return an accurate result. If the outcome is not a correct delineation of the watershed, right click the delineation in the QRiS pane and delete. Repeat the process, clicking a slightly different point on the map, aiming for the NHD flowline, until an accurate result is achieved.
Demo Video
Add High Resolution Aerial Imagery
In the QRiS pane > Your project > Inputs > right click on Surfaces > Import Existing Raster Surface Dataset
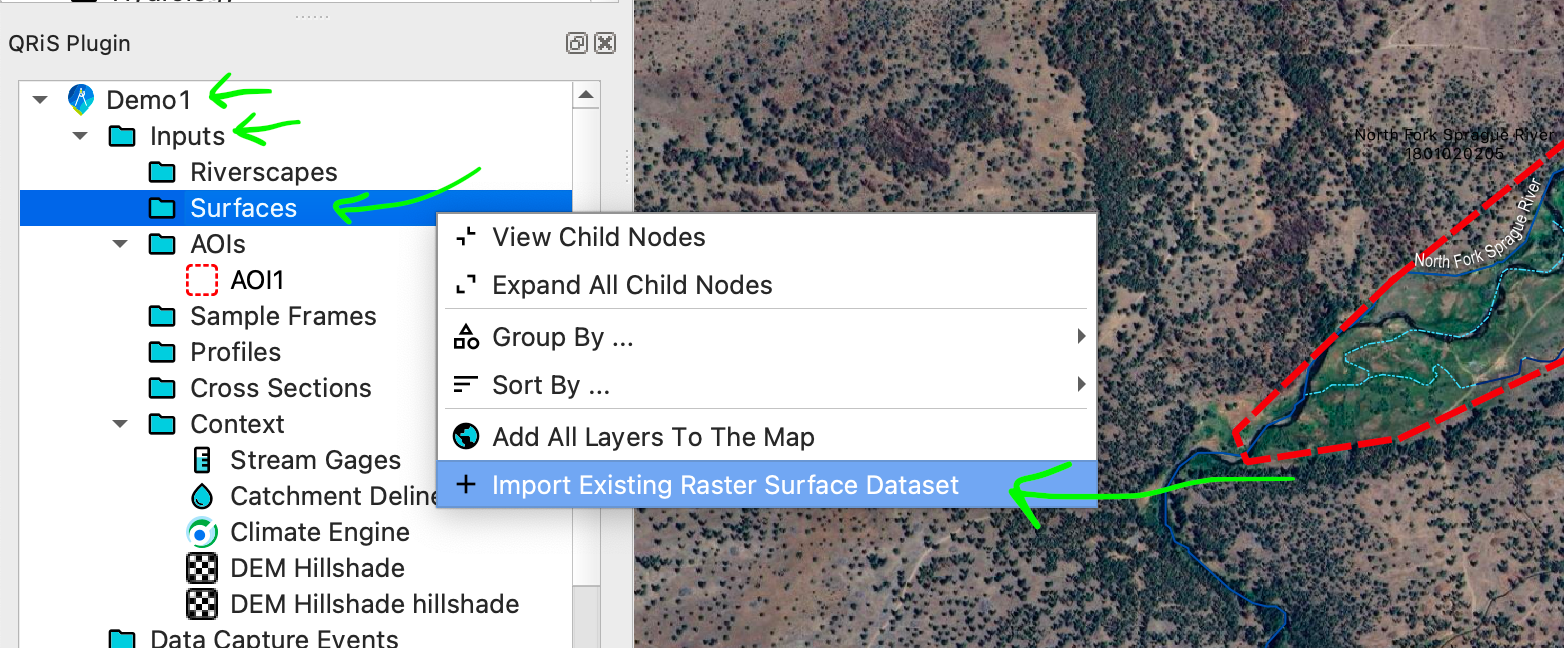
Find your imagery file.
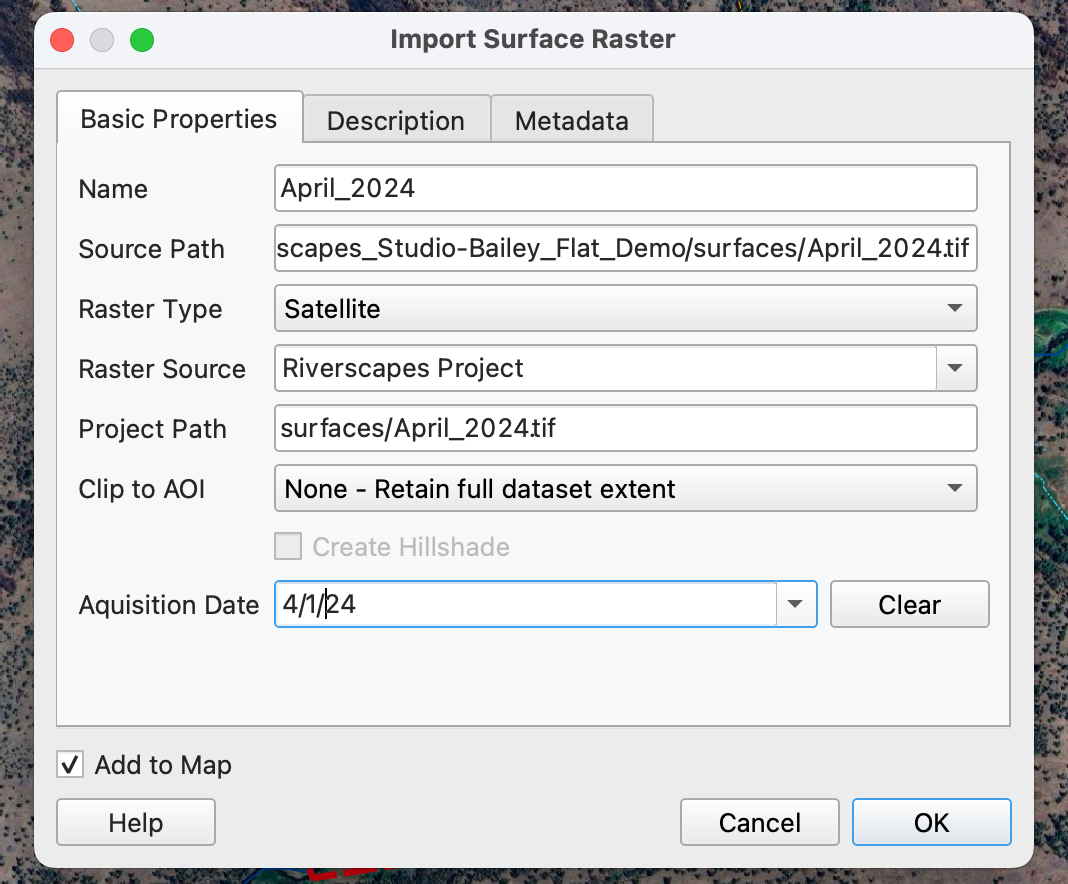
The Import Surface Raster window will open. Choose your Raster Type and Source and enter an Acquisition Date. Entering a date keeps multiple data capture events organized. You can clip imagery that is larger than needed to your AOI.
After importing the Imagery build pyramids for the image to increase rendering speed when panning around your project.
Add the imagery to the map by either right clicking on the file under surfaces and add to map, or double click on it in the same place. Once it is in the map double click on the layer to bring up its properties. Navigate to the Pyramids tab and select all the different resolutions on the right hand side. Make sure External is selected under overview format, and resample method can be left as Average. Click build pyramids, once it has finished click apply then ok.
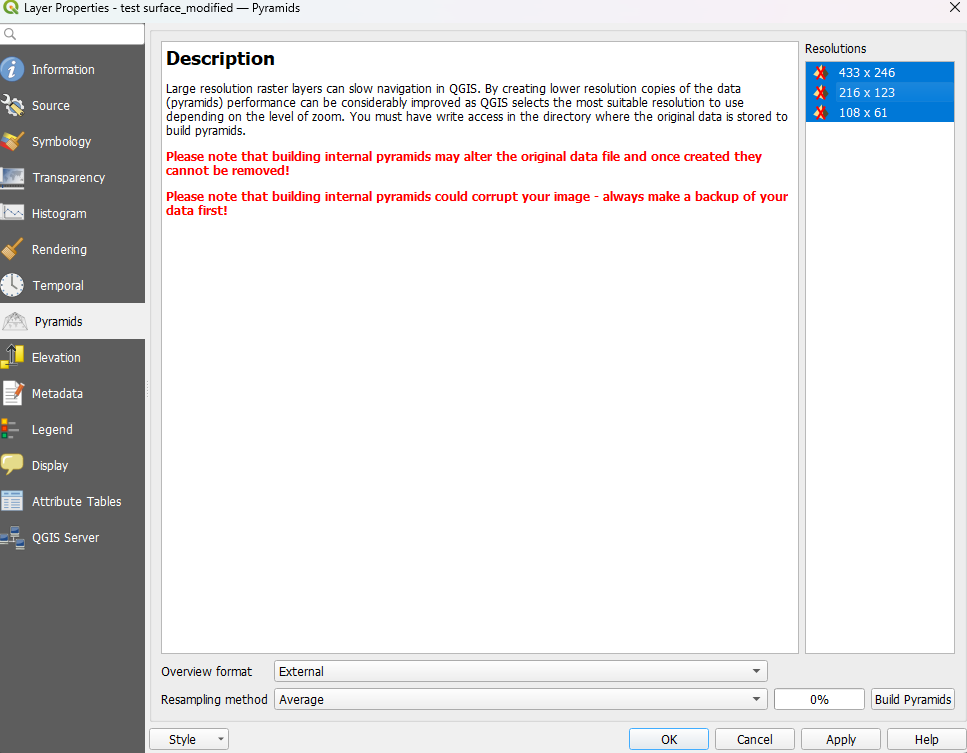
This is not a necessary step but will improve the ease of use when digitizing off of imagery, especially for large file sizes.
Demo Video
Additional Rescources
This playlist includes some best practices mentioned earlier in the workshop includning digitizing, georeferencing, and a discussion on resolution and building pyramids.
Desk Guide - Getting Started in QRIS
The Desk Guide can be downloaded here
The full project example data used in this workshop can be downloaded here.
Data that was imported into the project from the local drive can be found here if you would like to create and empty project and work through the steps of importing existing data like surfaces into your project. To do so download and unzip. Data is stored in a .gpkg which behaves the same as a folder when navigating to the existing dataset through QRIS.