QRiS Workshop 3 - Planning
Workshop 1 & 2 Review
At this point in our Wall Creek Example project we have done the following
From Workshop 1:
- Created a new QRIS project
- Added layers to our QRIS project directly from a Riverscapes Context project in Riverscapes Viewer.
- Delineated an Area of Interest, both by manually drawing as well as using the Catchment Delineation Tool
- Added aerial imagery to our project for context and digitizing riverscape features
From Workshop 2:
The main purpose of Workshop 2 was to go through the NRCS Conservation Planning Process using protocols in our QRIS project. This process consisted of the following:
- Added a lidar DEM/hillshade for context
- Created a Data Capture Event using the Geomorphic Mapping of Riverscapes(experimental) protocol
- Mapped geomorphic units using our hillshade and aerial imagery as evidence
- Mapped our valley bottom/riverscape using our geomorphic layer as context
- Mapped confining margins using valley bottom/riverscape and geomorphic units as context
- Added risk layers and recovery space from the LTBPR Protocol
- Mapped risk and recovery space using risk and valley bottom to inform our total recovery space\
- Created sample frames and ran an analysis to calculate active proportions and recovery space within our riverscape
Video Overview of Workshops 1 and 2
Purpose
Today we are going to expand and the basic planning process we did in Workshop 2 by exploring differing ideas of recovery space and how that might inform our reach breaks for current conditions. We will use that as well as other contextual layers to differentiate reach objectives that will inform our complex designs in Workshop 4. Furthermore we will perform Analyses again and explore how we can export that data to create indicator tables and figures to aid in our reporting.
Resources
Data for Demos and Excercises
Wall Creek Demo - Riverscapes Studio Projects
Riverscapes Studio Collection consisting of a starter projects (with and without surfaces/imagery), as well as the final project that this workshop will result in.
Resfresher on the Planning Process
Moudle 3C
Reading Riverscapes & Mapping the Valley Bottom
Moudle 3D
Mapping and Estimating Structural Forcing
Moudle 3E
Resource Inventory & Analysis - Risk Assessment, Condition Assessment & Recovery Space
Moudle 3F
Connecting & Clarifying Objectives & Tying to Goals
Project Indicator Template
An example template based on Table 3.1 on page 8 of Chapter 3 of the LTPBR Design Manual. is provided below.
| Resource Type | Suggested Resource Link | Notes or Alternative Resource |
|---|---|---|
| Project Indicator Template | Condition Worksheet.xlsx | This is an excel template worksheet for populating active channel, active floodplain, vs. inaccessed floodplain mapping of your valley bottom as a means of cataloging condition and estimating recovery space and constraining design. To the extent possible, you will be using QRiS Analyses to populate these tables (one for every sample frame or reach). |
Overview of Project Indicator Template
This 7 minute video gives an over of the condition worksheet (from Capstone class and different example project).
Warning, most people grasp the idea of choosing the rows for this table (i.e. metrics and indicators) fairly quickly. They then realize that planning is essentially three columns of this table: existing conditions, estimated historic (for reference) and estimated future conditions (i.e. recovery space). Most tend to grasp the concept of recovery space being limited by estimated histroic too. What confuses people most is how many tables they will end up with. You have a separate table for every sample frame or area of interest you choose as the spatial extent of your analysis.
Some think, all I need is one table for my entire property or project area. This may be simple and fine in some cases, but it often makes it difficult to differenatiate important spatial differences in condition and recovery space across the project area. This is why we often have multiple sample frames.
Self-Paced - Tutorial 3
Download and Open Existing Project
- Go to the Wall Creek Demo Project Collection in the Data Exchange
- Download one of the starter projects
The Wall Creek Demo Starter without Imagery is only 40 MB. Whereas, the Wall Creek Demo Starter with Surfaces] with surfaces and drone imagery is 1.7GB!
- Extract the downloaded
.zip - Open QGIS and click the
QRIS plugin→Project→Open QRIS project - Navigate to the extracted folder and click on the
qris.gpkgthen clickOpen
Demo Video
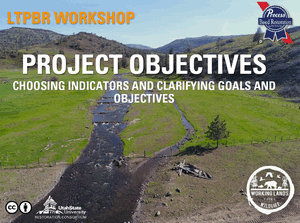
Mapping Recovery Space
- Right-click
Data Capture Eventsnode → and chooseAdd New Data Capture Event - Scroll to the
Anabranch Planning Protocol(make sureShow Experimental Protocolsis checked) - Under that Protocol, select and add layers:
Recovery Space - MinimumRecovery Space - Maximum
- Name the DCE something useful, like
Workshop 3 Planning - In the
Basic Propertiestab, set the data or date range based on LiDAR captured dates- In our example, the LiDAR was captured between
11/4/2019-8/19/2020
- In our example, the LiDAR was captured between
- Under
Surfaces, select your LiDAR surface and high-res imagery - In the
Descriptiontab, write a brief description of this DCE. A good description in this example could be,
This DCE represents the planning portion of this project. It is based on high resolution imagery and LiDAR.
- Right click one of the recovery space layers in the DCE and select
Import Features From→Riverscape Valley Bottom - Add that layer to the map → start editing the layer -> use the reshape tool to reshape the feature → save and toggle editing
- Repeat steps 8 and 9 with the other recovery space layer.
Demo Video
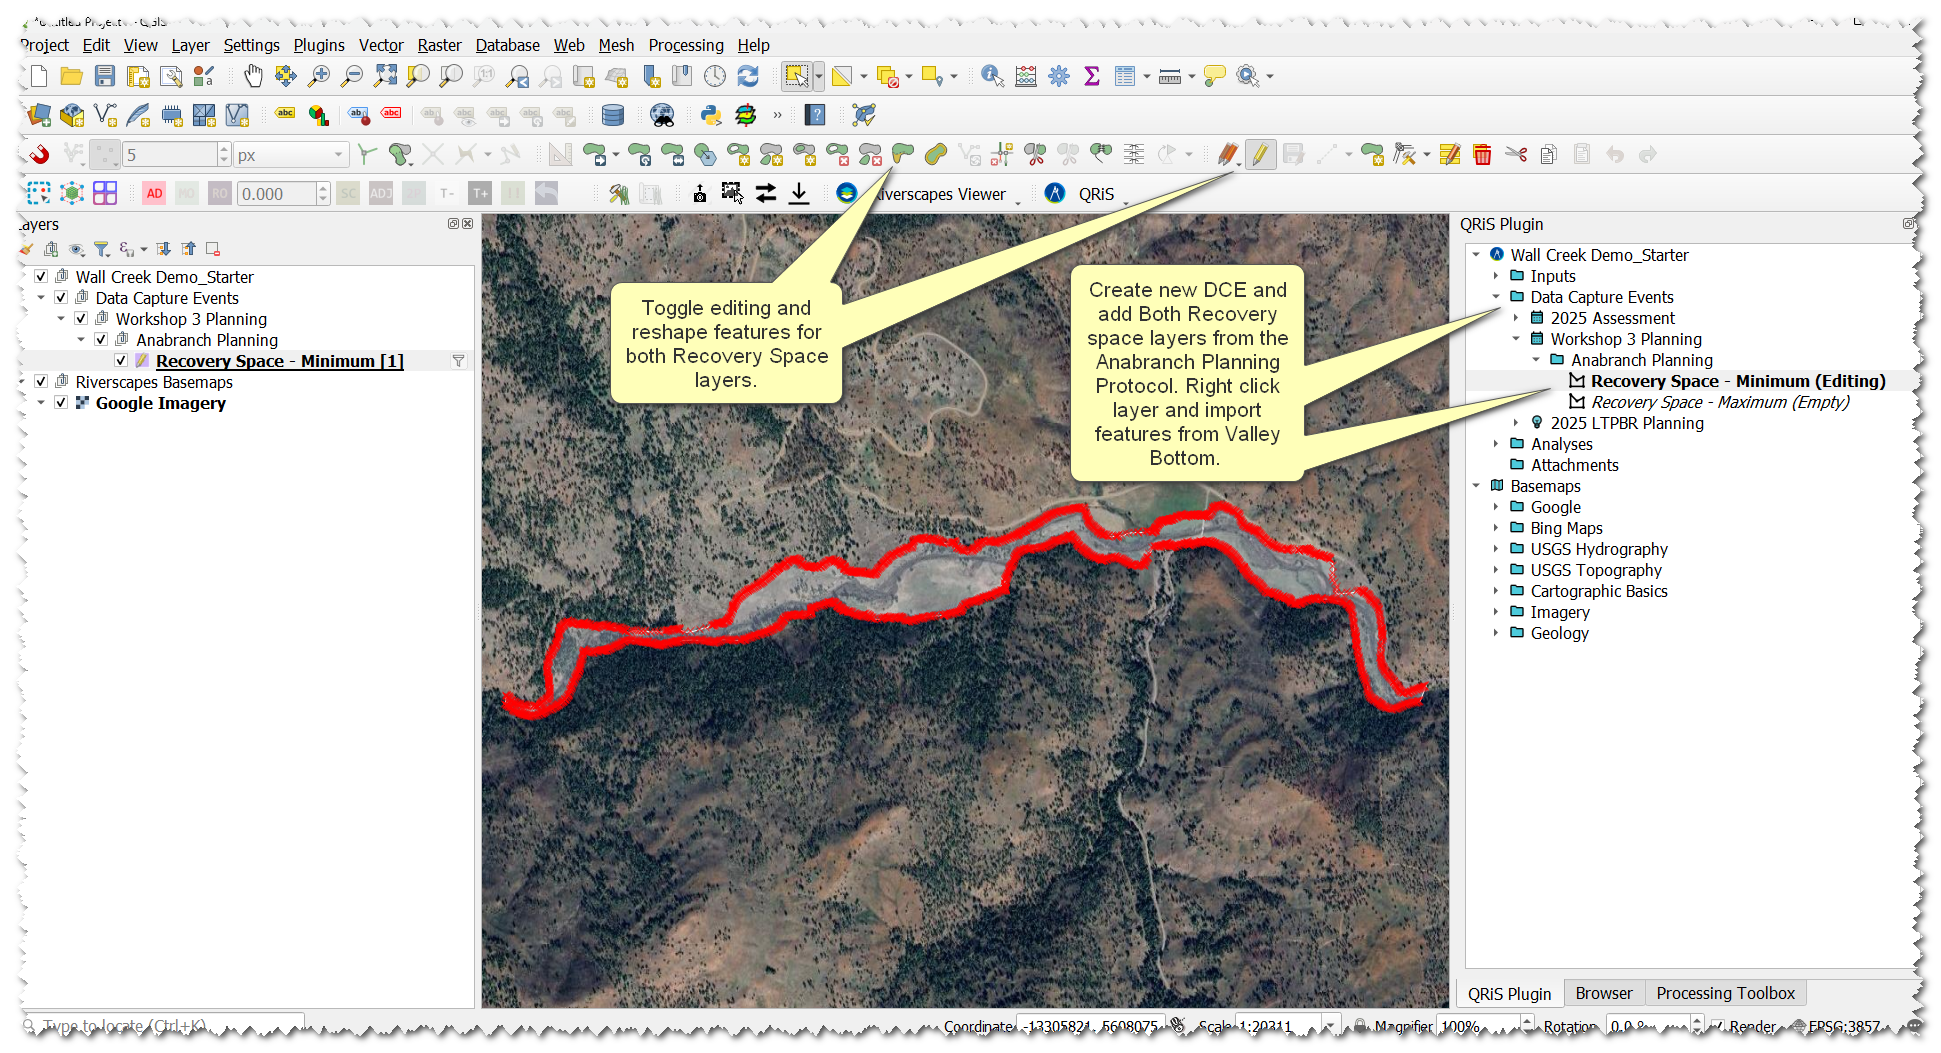
Creating Reach Breaks and Sample Frames
- Right-click
Cross Sectionsnode → +Create New (Manually Digitized) Cross Sections - Add that layer to the map and begin editing that layer
- Digitize cross sections where you have deemed reach breaks to be appropriate given reach objectives, risk constraints, and geomorphic characteristics
- Save edits and toggle editing
- Right click your cross sections layer in the QRIS panel and select Generate Sample Frames
- In the pop-up give the sample frames a unique name and select the appropriate valley bottom, centerline, and cross sections to derive the sample frames from, click
OK
- In the pop-up give the sample frames a unique name and select the appropriate valley bottom, centerline, and cross sections to derive the sample frames from, click
Demo Video
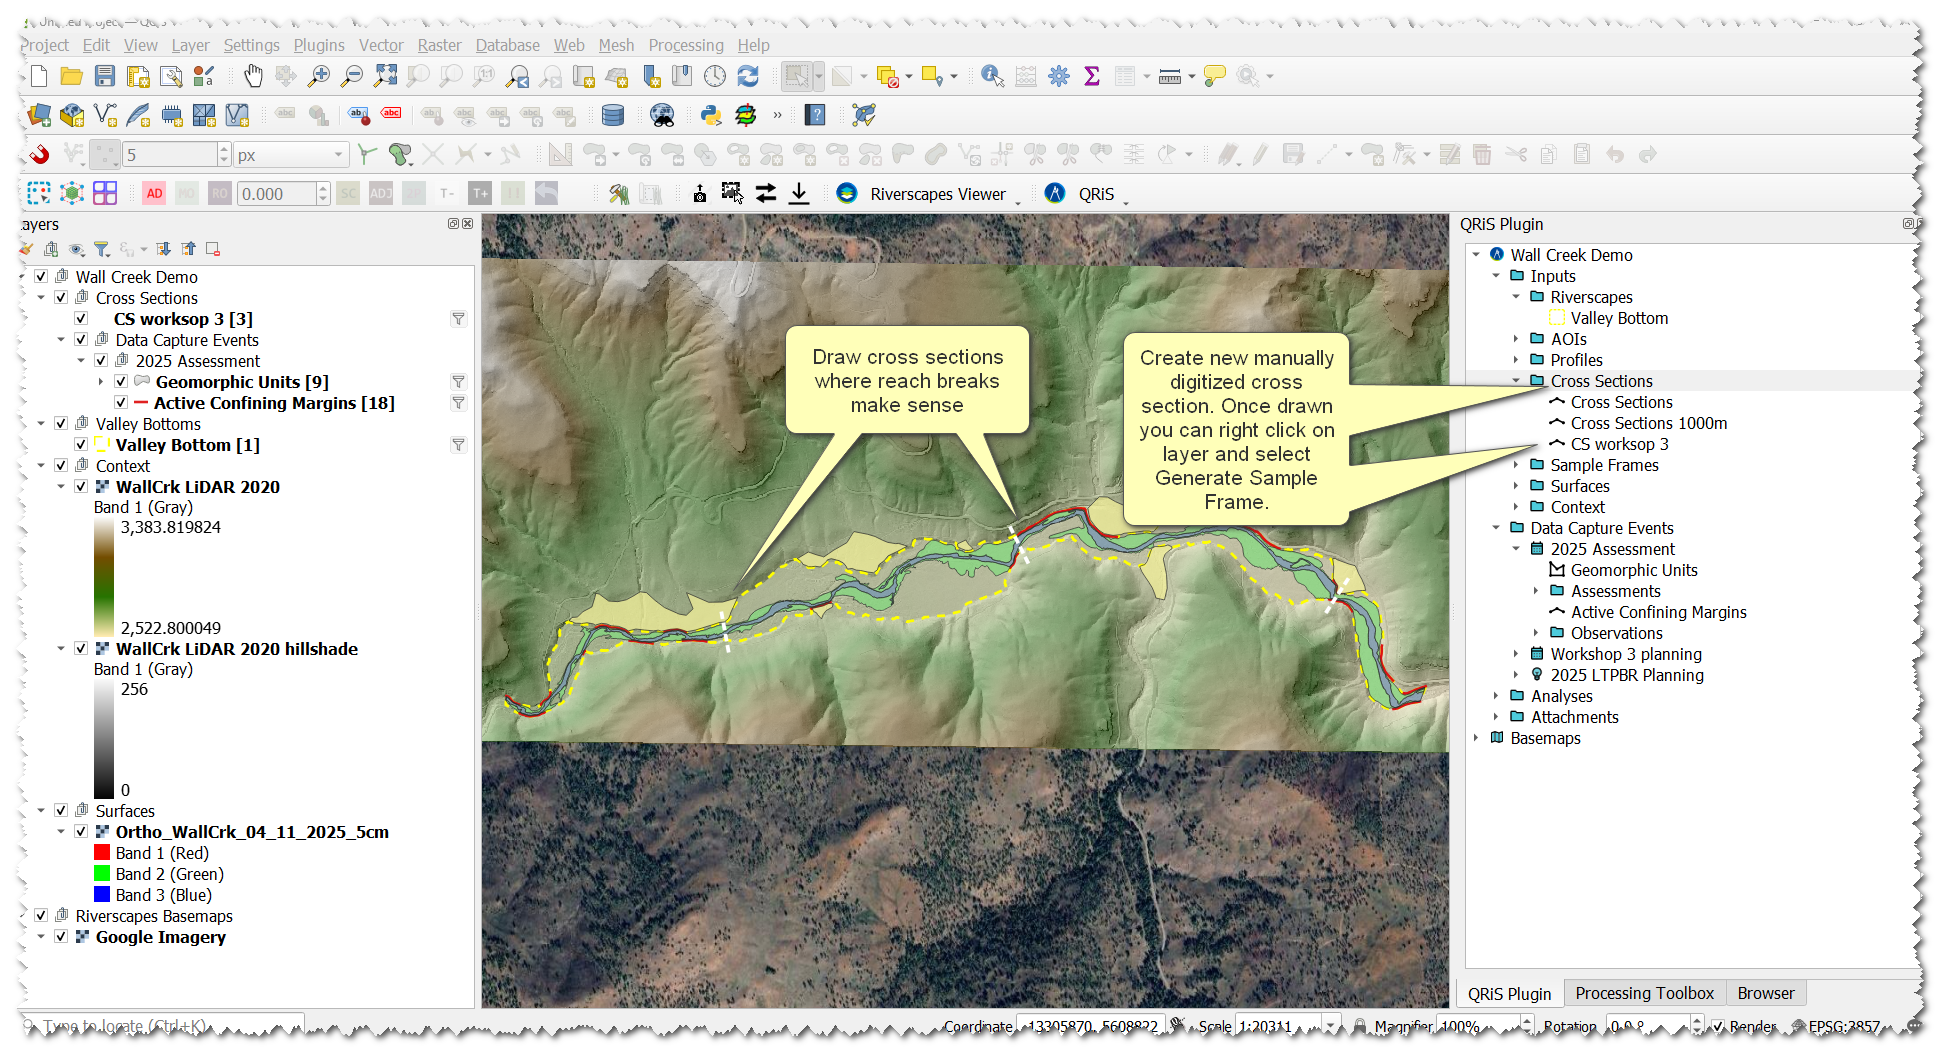
Analysis
Now that we have created sample frames we can use those to create an analysis and calculate metric values derived from features we digitized.
- Right-click the
Analysesfolder →Create New Analysis - Give the Analysis a name
- Select the sample frame layer we just created to calculate metrics in
- Select the appropriate valley bottom layer, centerline layer, and DEM layer
- You will see a large list of metrics to select from. Click none at the bottom-right to set all metrics to none. Setting all to none allows you to go through and only choose the ones you want to calculate. Change the dropdown to metric on the following metrics:
Dam count(Version 2, click help icon to find the correct one)Dam densityJam CountJam Density(Version 2, click help icon to find the correct one)Active Floodplain ProportionMaximum Potential Uplift AreaMaximum Potential Uplift(% of Riverscape)Minimum Potential Uplift AreaMinimum Potential Uplift(% of Riverscape)
- Click
OK
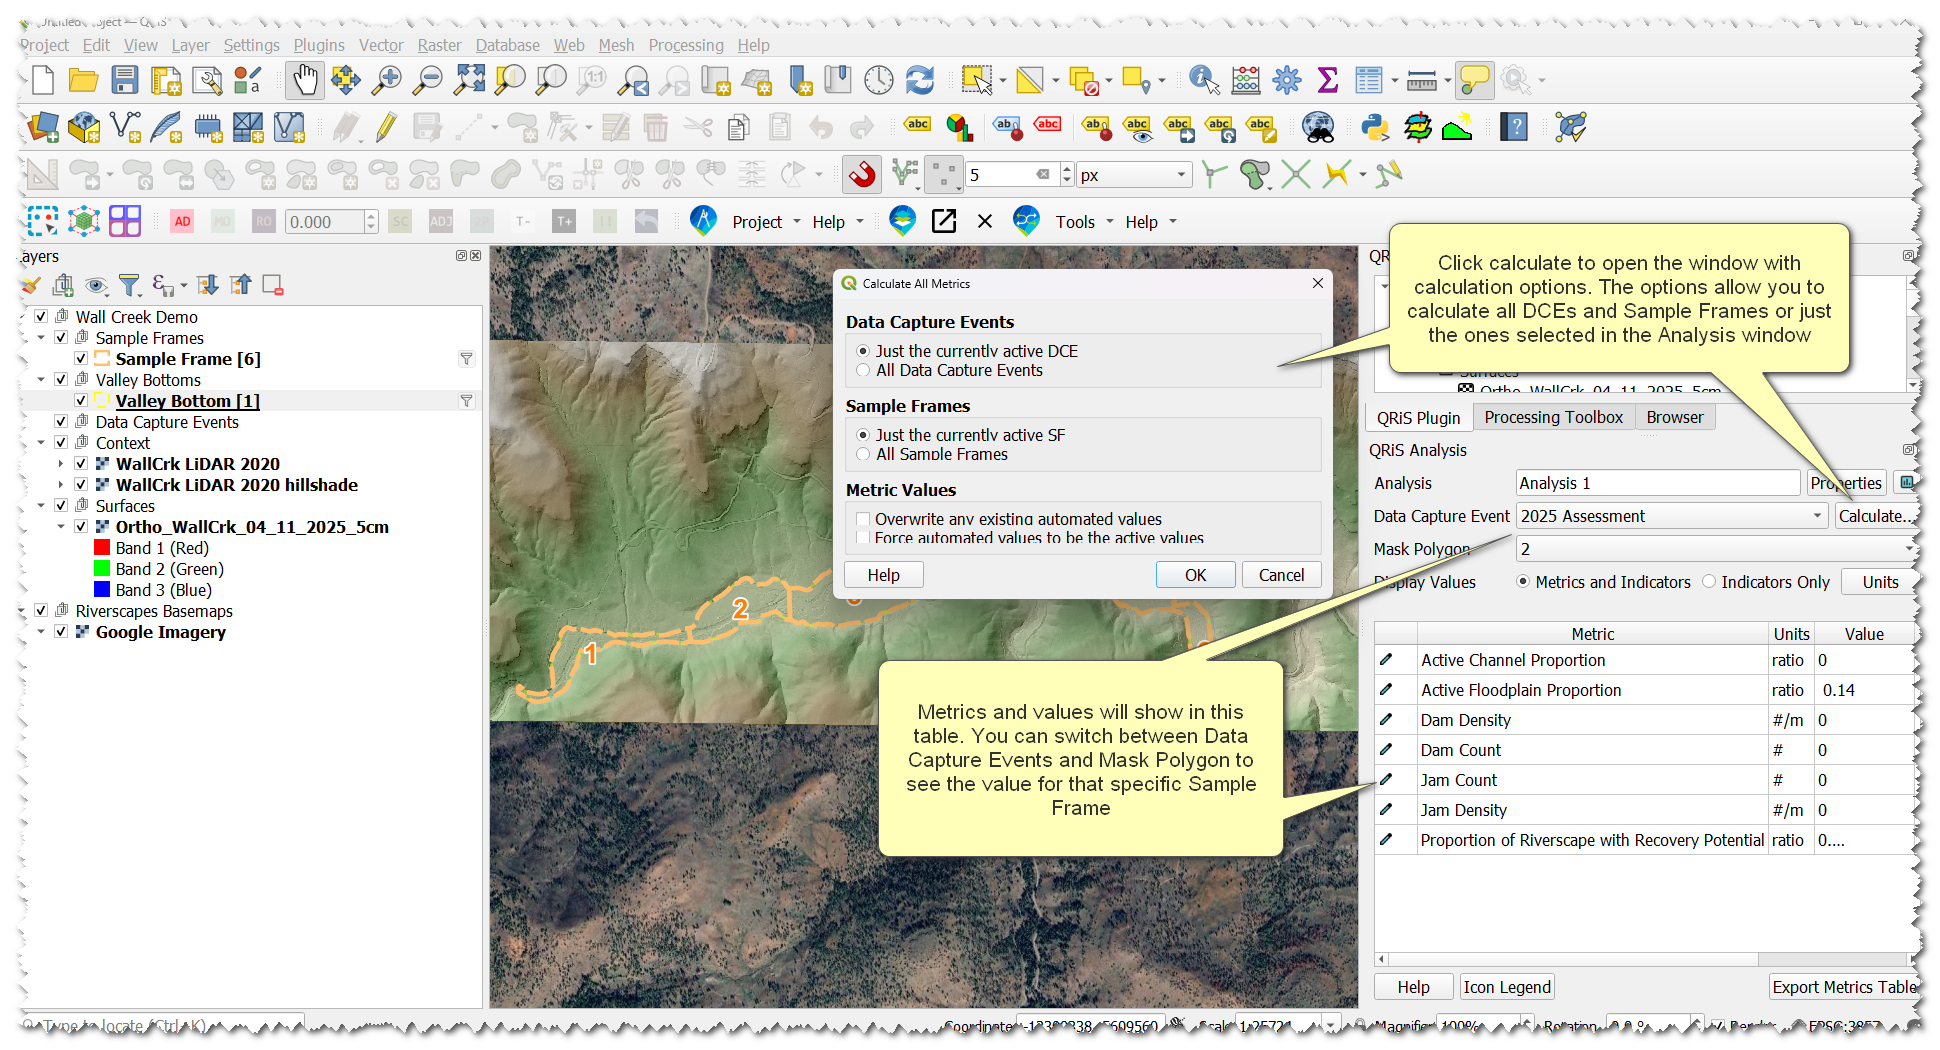
- On the window that pops up click
Calculate - On the new window select All Sample Frames and and all Data Capture Events, click
OK - Values will calculate and populate in the table of metrics. Under the Mask Polygon Dropdown you can switch between your different sample frames to see the different metric values.
Metrics can be recalculated at any time and values can be overridden with manual values if necessary. More help can be found on the Analyses help page.