josh_temp
Data
QRiS Example Projects
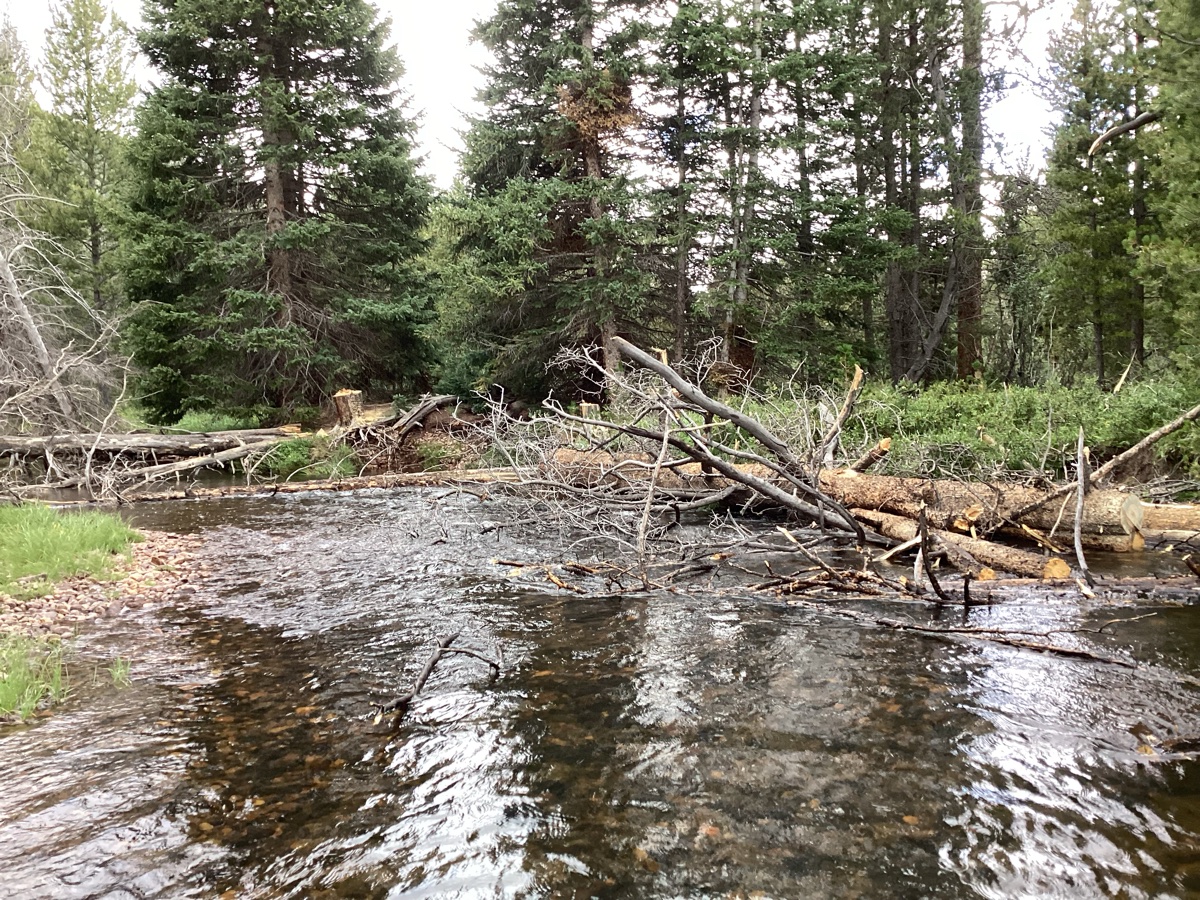
Spawn Creek
Demo project on Spawn Creek (tributary to the Logan River) inb Northern Utah. This project was created to track beaver dams over time after the introduction of a cattle exclosure.
Bailey Flat
Demo project in South Central Oregon. This multiphase project was created to show how multiple DCEs from monitoring efforts result in an analysis of metrics.
Willow Springs
Demo project on Wychus Creek in Sisters, Oregon. This project was curated to explore how QRIS stores and organizes multiple phases of Designs, As-Builts, and DCEs.
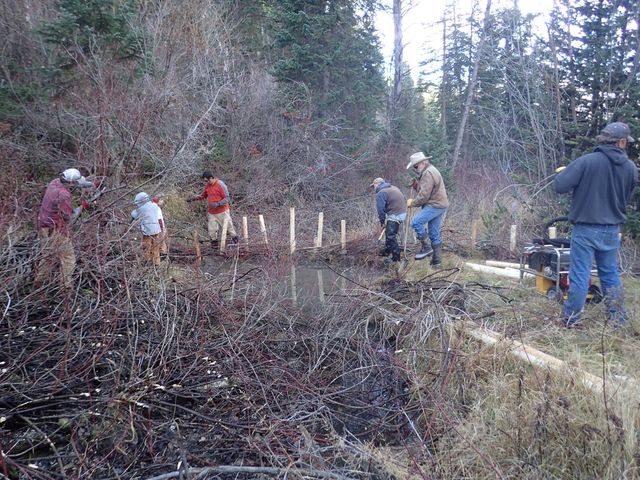
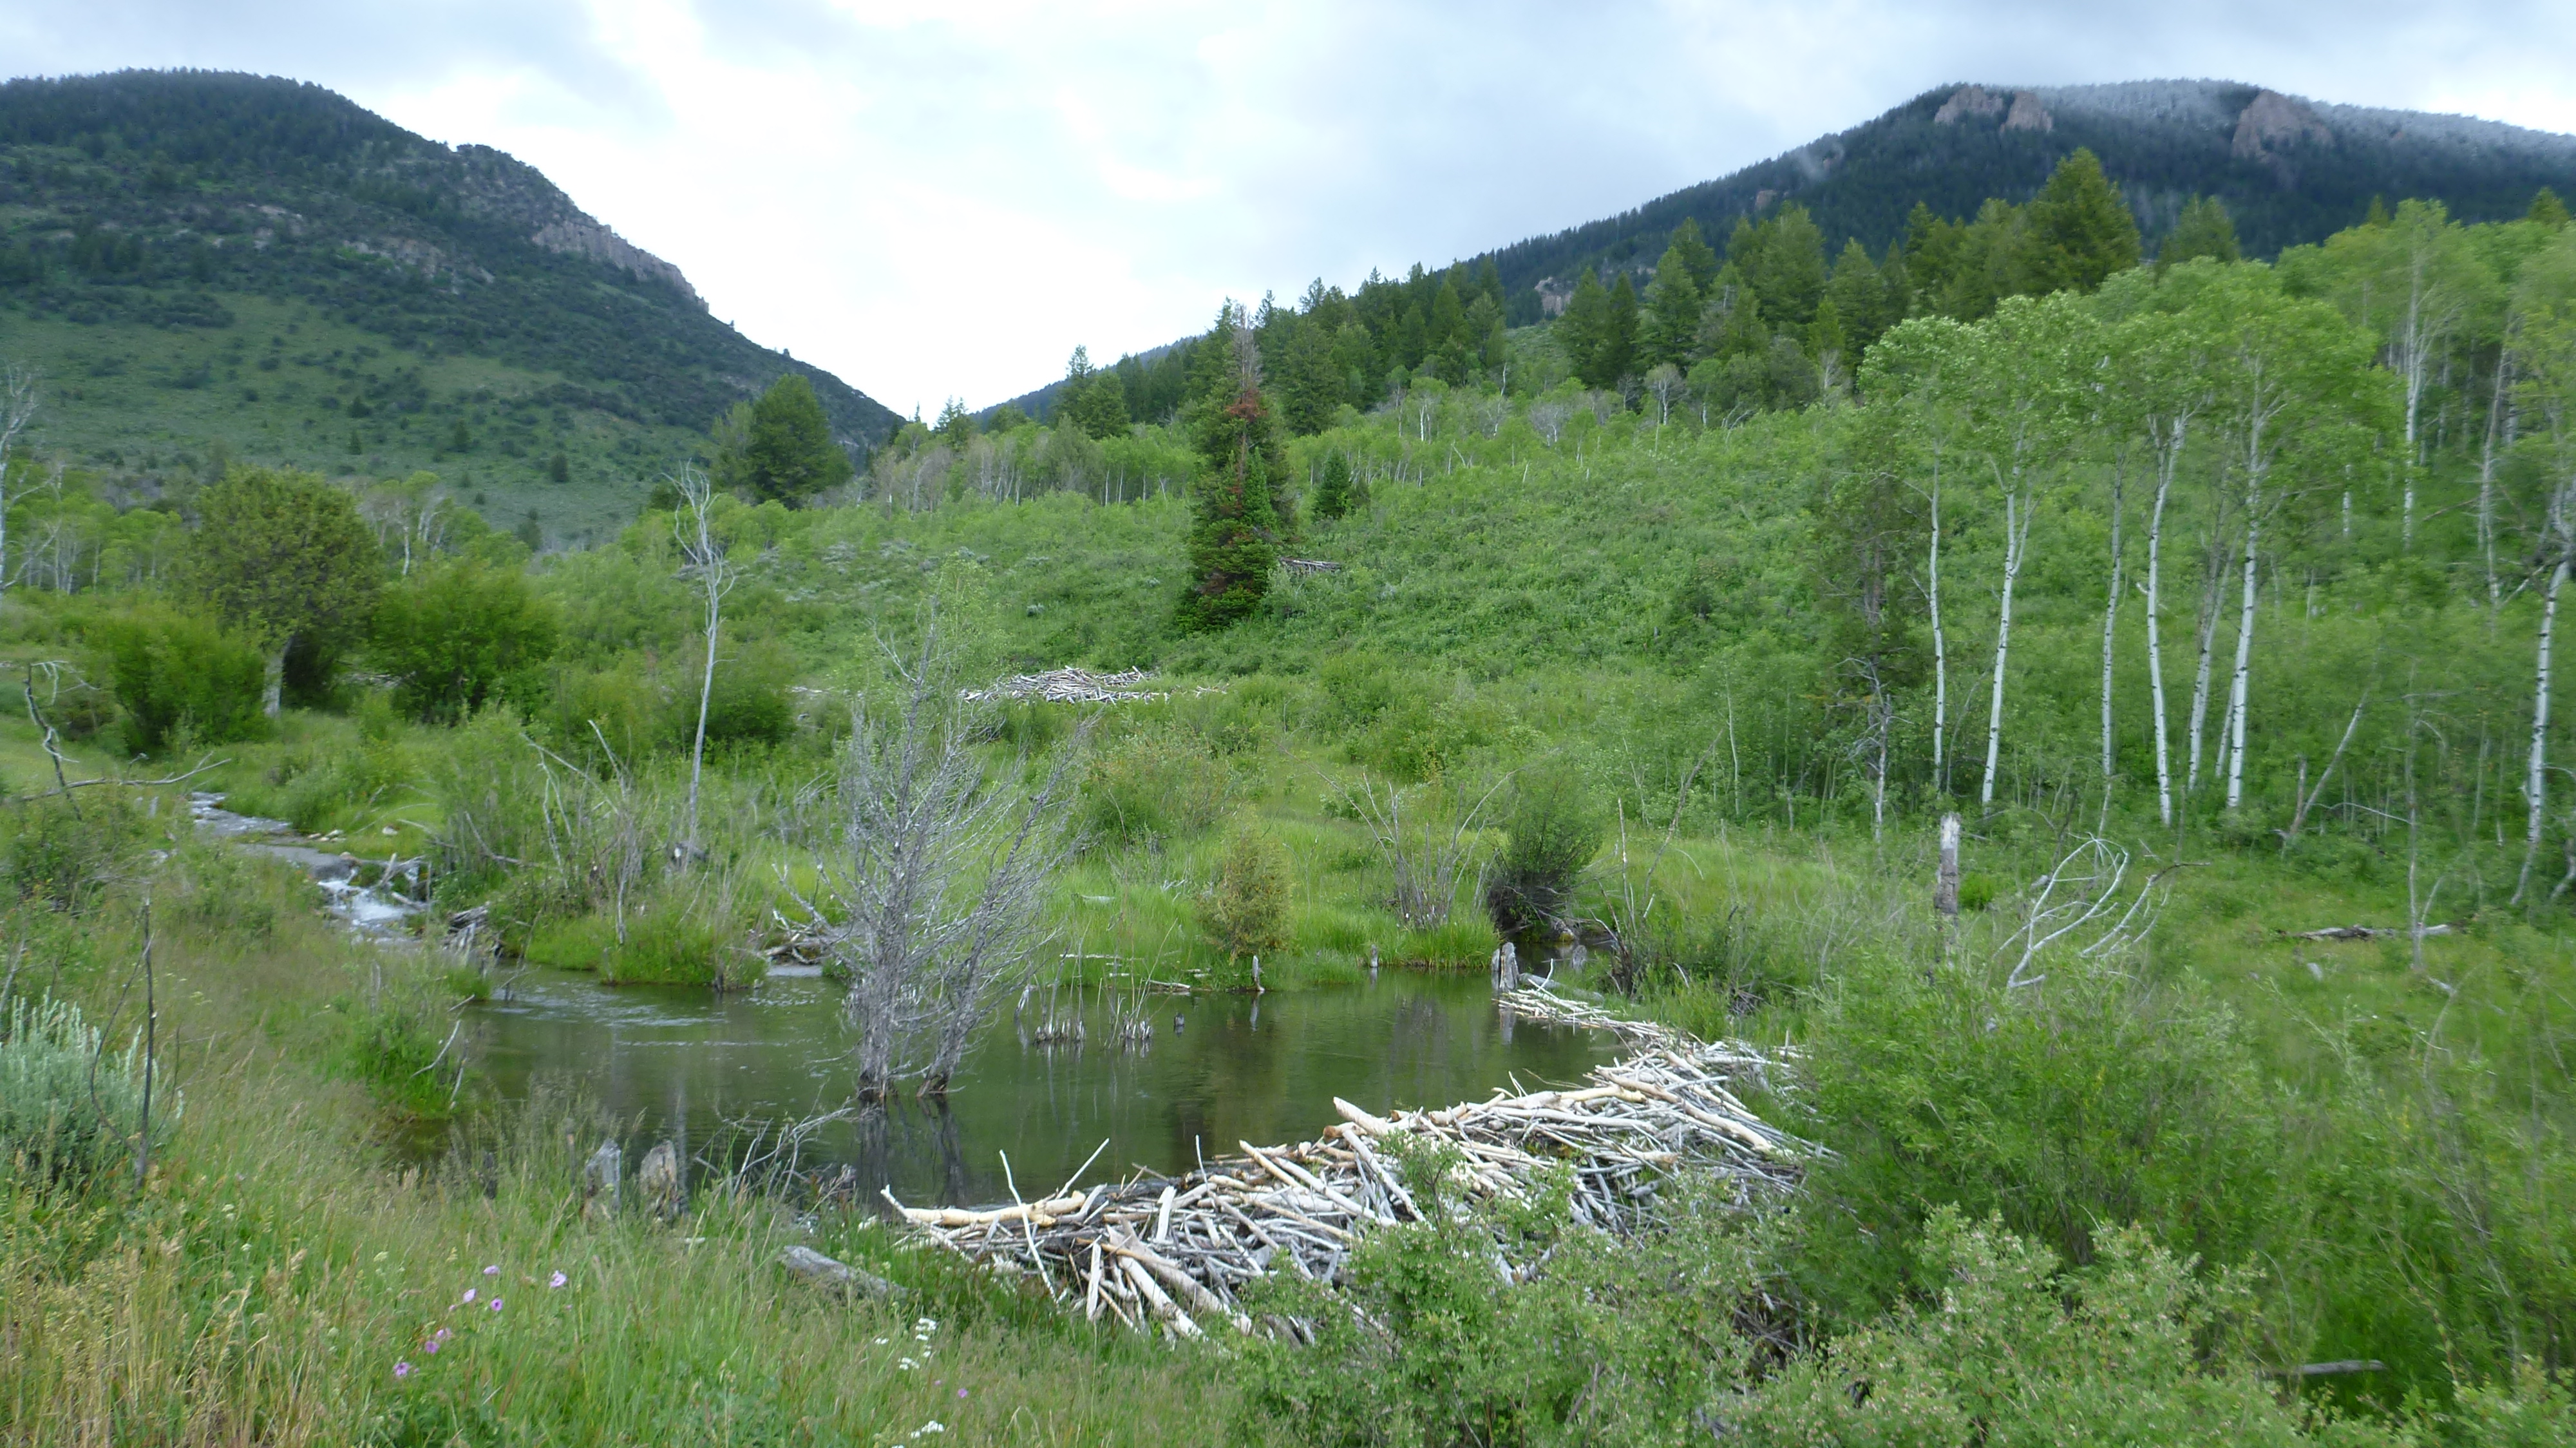
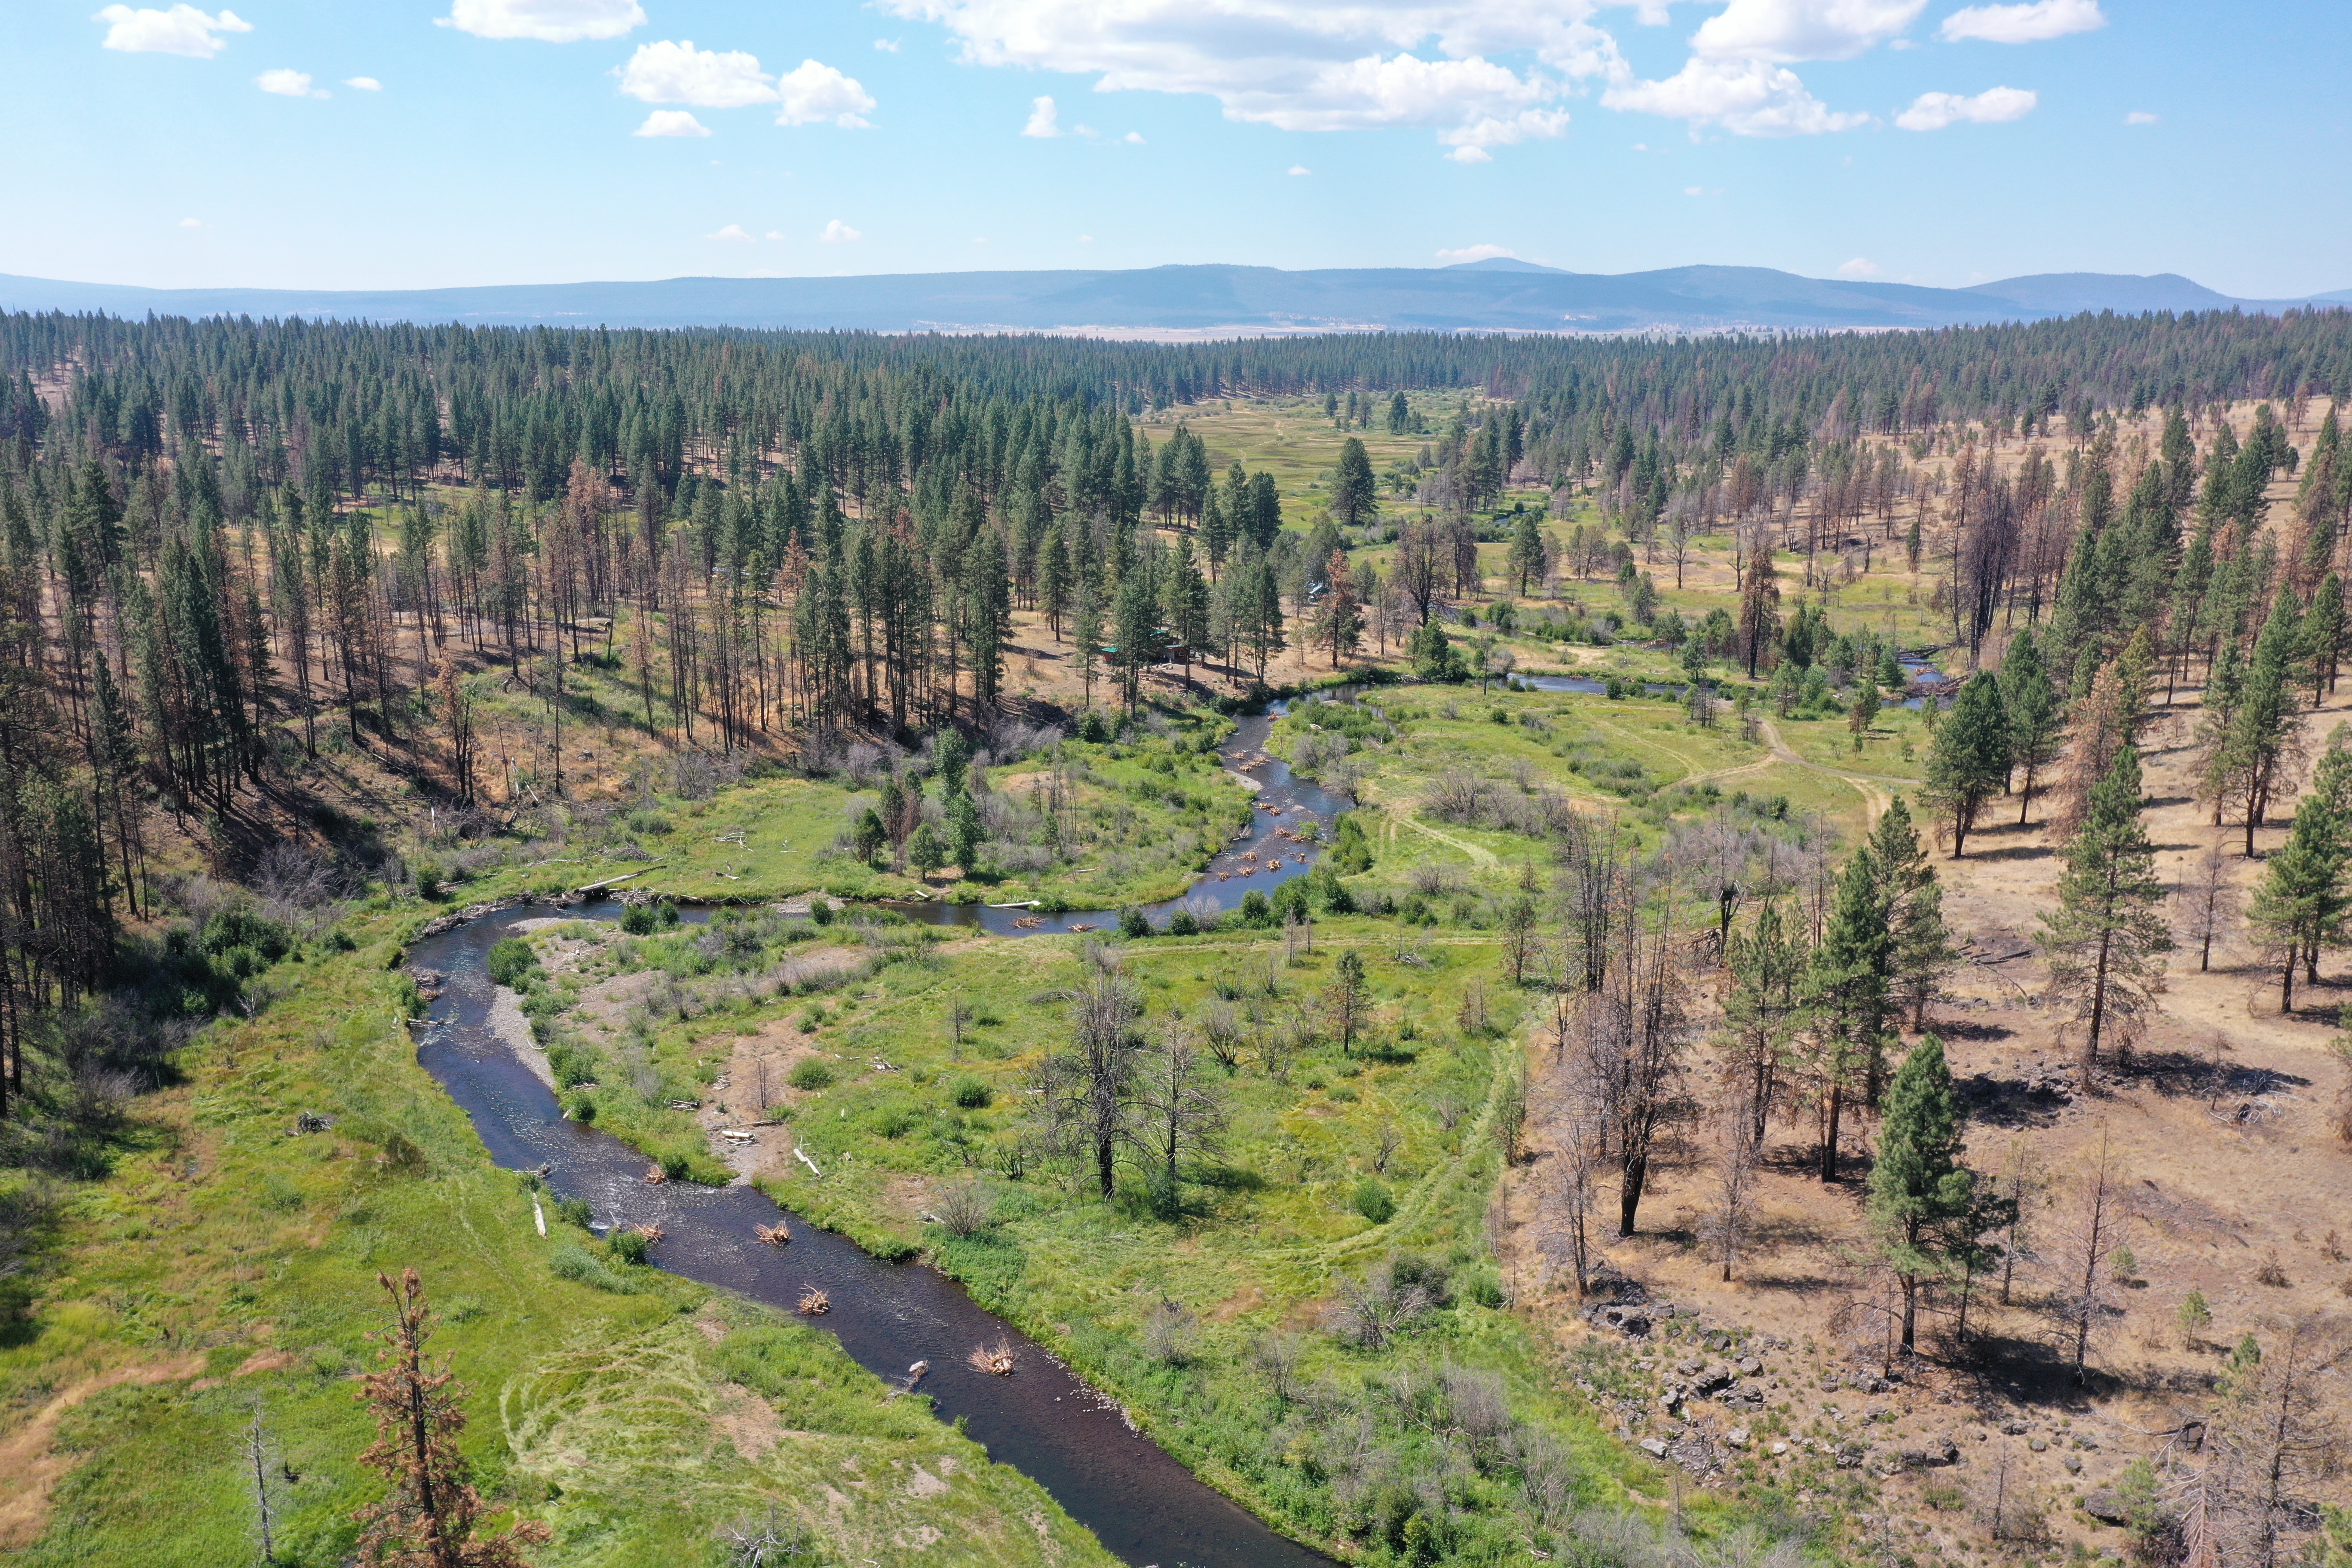
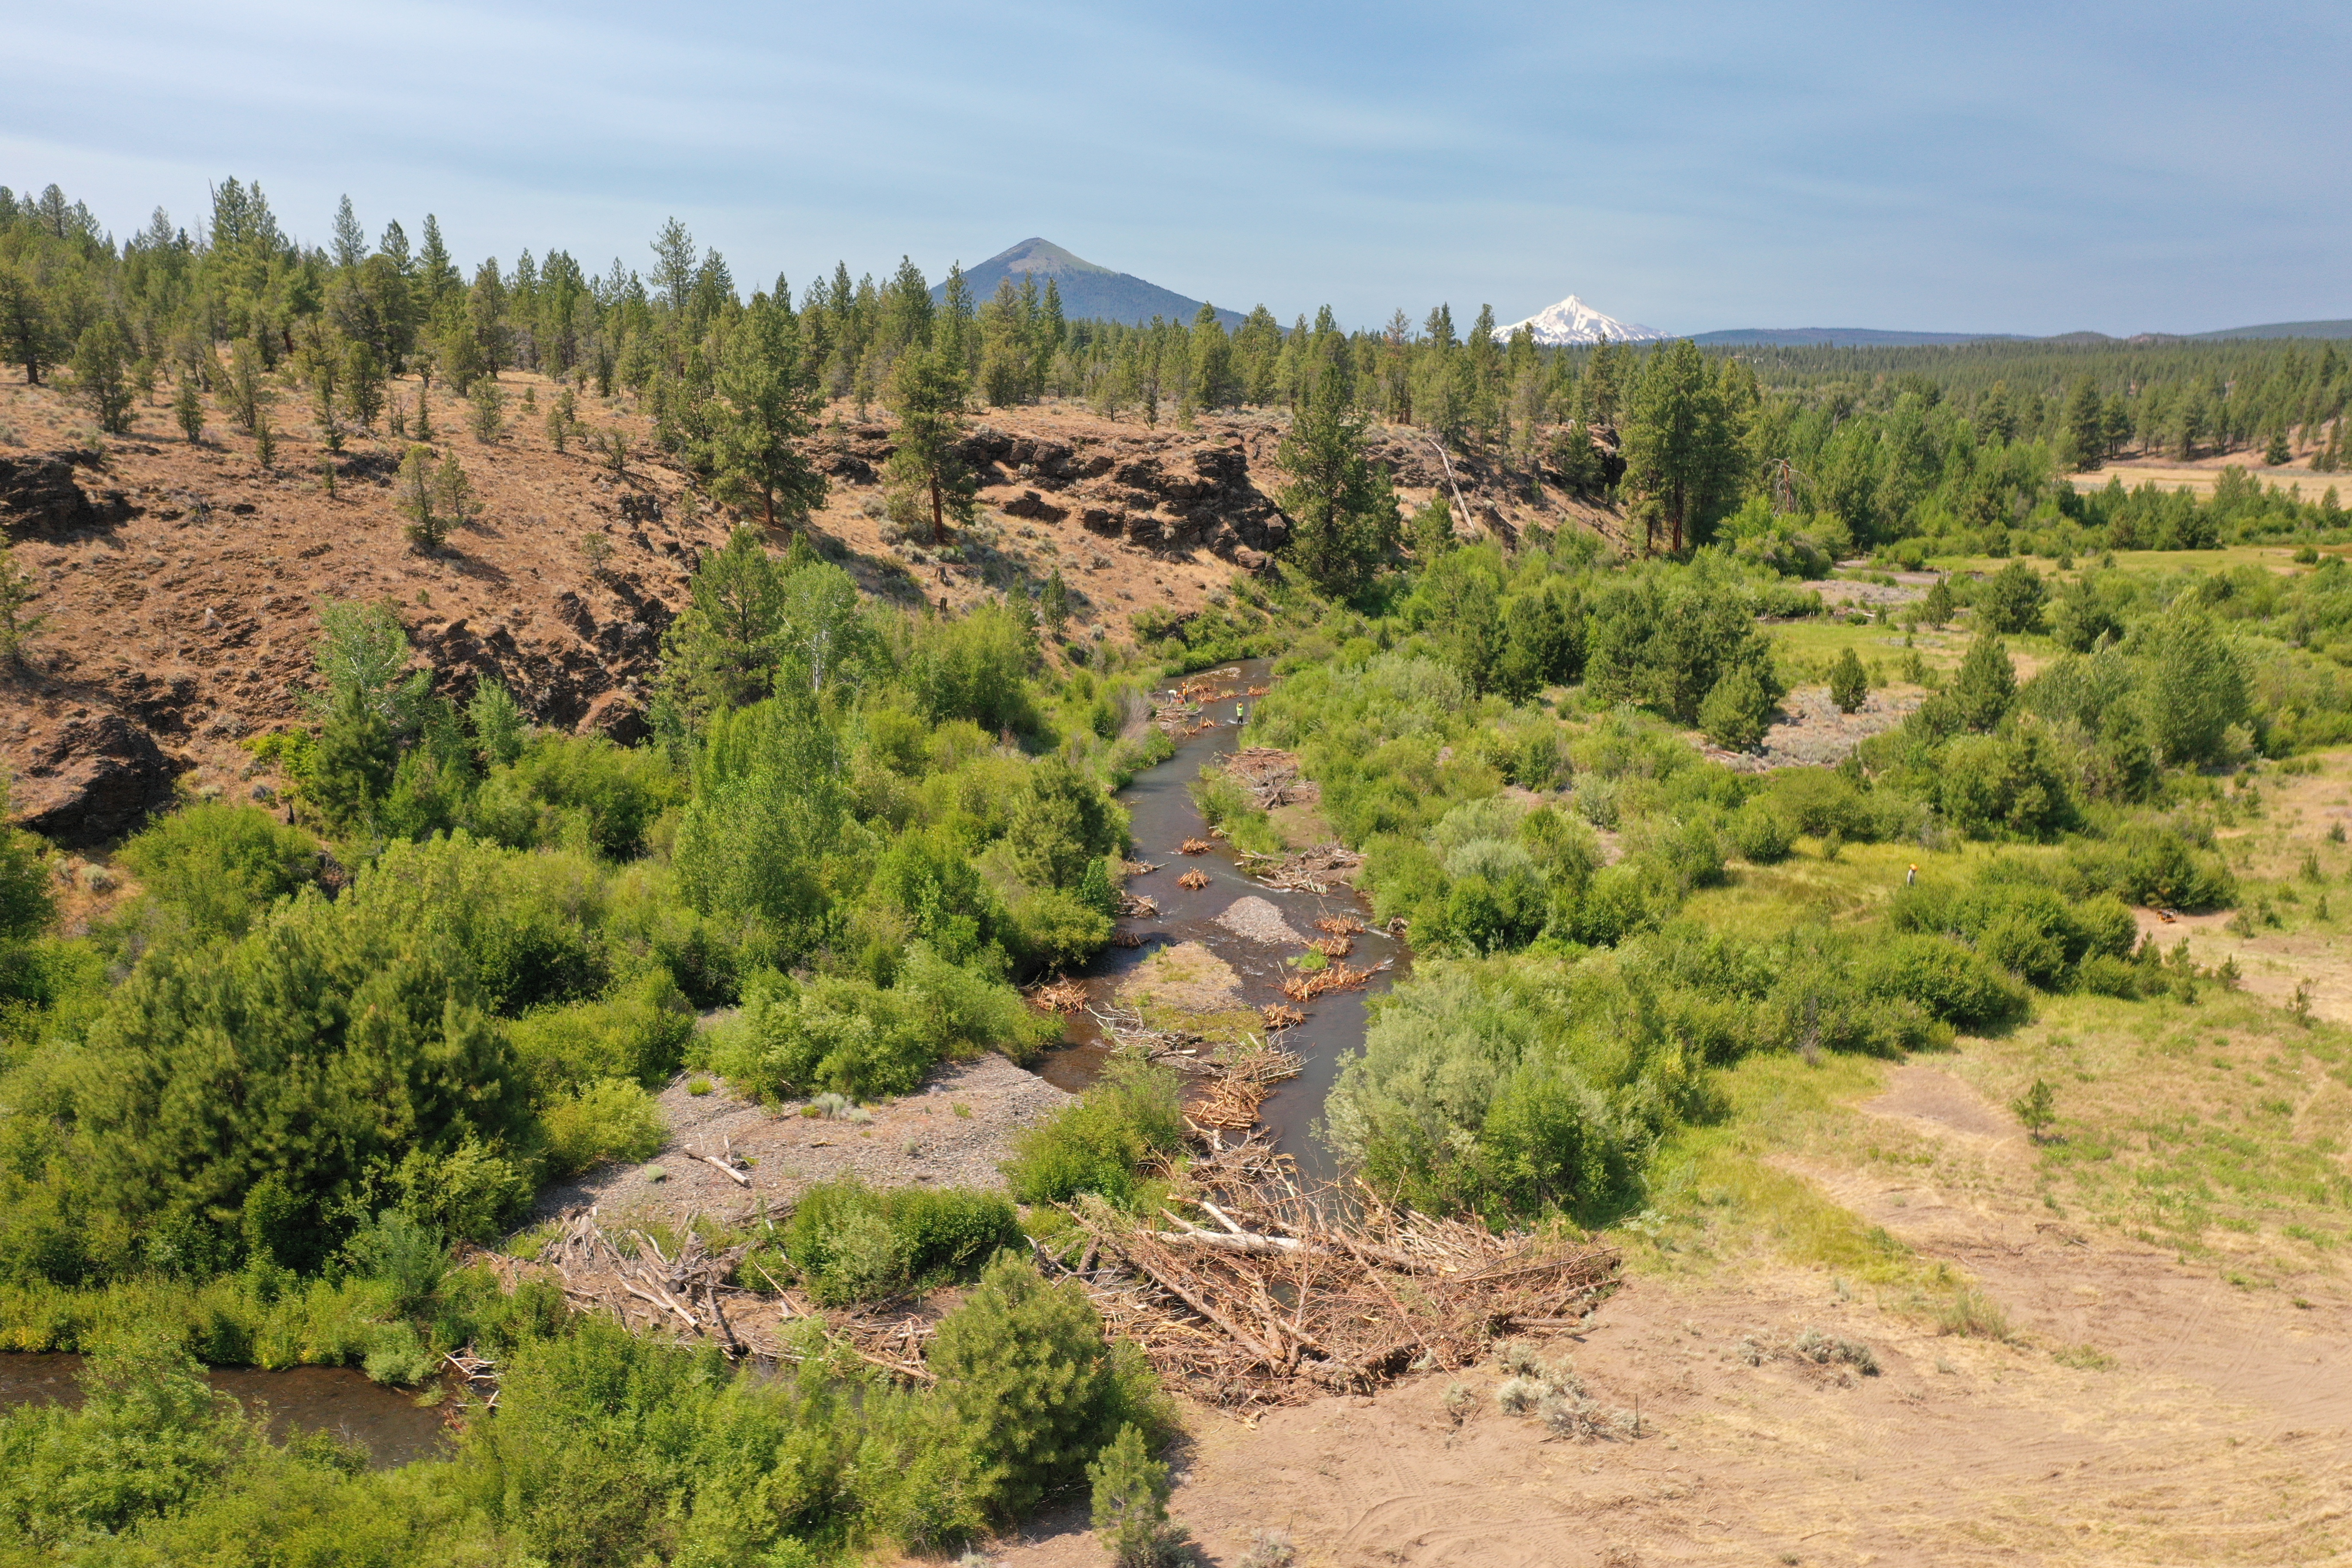
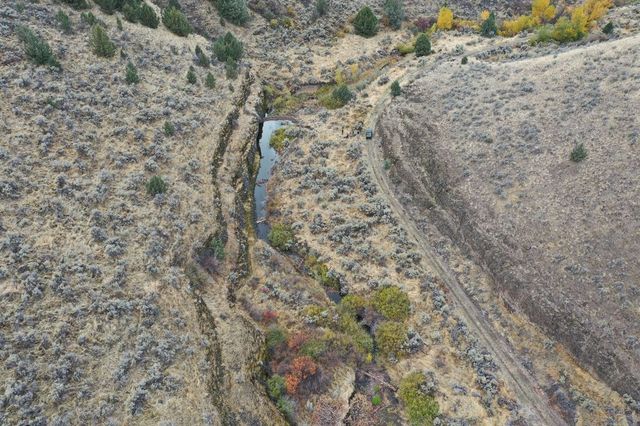
Birch Creek
Demo Project in Southern Idaho. This project spans many years with the goal of using beaver to return perennial flow to Birch Creek, a simple but effective example of organizing data and keeping track of a timeline in QRIS.
Upper Thirtymile
Monitoring project in Northeastern Oregon. This project was created to assess riverscape features from aerial imagery in June of 2019 and October of 2020 and compare riverscape changes at two reach locations (Irzik to Badger Canyon and Comstock Basin) after implementation in 2022.
Upper Bear
Demo project on Upper Bear watershed in northeastern Utah. This demo project shows different forms of monitoring at reach and watershed scales to calculate riverscape metrics.
Channel Junction Mapping
Active Channel Lines Mapping
Active Channel Extents Mapping
Structural Elements Mapping
Dam Crest Mapping
Jam Area Mapping
Inundation Extents Mapping
Vegetation Extents Mapping
Active Extents Mapping
Geomporphic Units Mapping
Final LTPBR mapping Overview
Birch Creek Exercise 1 (new project, digitize dams, SF, analysis)
- Click on QRIS logo and select Project > '+ New QRIS Project'. Give it a name and save location and click ok.
- Right click on Data Capture Events node and select '+ Add New Data Capture Event'. In the dialog box that pops up do the following:
- Give the DCE a name
- Make sure the box next to SHow Experimental Protocols is checked.
- In Available Layers locate the Beaver Protocol and select the Beaver Dam Survey layer and click Add.
- Click OK.
- Right click the Beaver Dam Survey layer and select add to map.
- Begin an edit session and start digitizing dam locations and fill out the form that pops up for each poin to add information about the dam at each digitized location. When finished save the edits.
- Right click on the Riverscapes node and select 'Create New (manually digitized) Valley Bottom'. Add that layer to the map and begin an edit session and digitize a Valley Bottom that encompasses all the dams you previously digitized.
- Right click on the Analyses node and select '+ Add New Anlysis'. Give it a name, select your previously digitized valley Bottom as the Analysis Mask. Set all metrics and indicators to None using the button in the bottom right. Then find the Total Dam Count metric and change it from none to Metric. Click Ok to open the analysis form.
- Click Calculate and leave the defaults in the pop up window and click ok to calculate dam cout within your valley bottom that was used as the sample frame.
Birch Creek Demo and Project Overview (Exercise 2- the story in qris format)
Birch Creek Exercise 3 (RIM DCE)
- Open the project you created in Exercise 1.
- Right click on the previously created DCE and select Properties.
- Make sure the Show Experimental Protocols box is checked.
- Browse in available layers to the LTPBR protocol and selct the Inudation Extents layer and click Add. Scroll to the River Inundation Mapping protocol and select the Dam Crests layer and click Add. Click OK.
- Individually digitize those two layers.
- Right click on your previously created analysis and click Properties.
- Find the metrics related to ponded, overflow, and free flowing inundation types and change them from None to Metric and click OK.
- Right click the analyis again and select Open Analysis.
- Now you can select Calculate and redo the calculation to calculate the metrics associated with the new layers you just digitized.