Monitoring Riverscape Health
Overview to CEWA/WATS 6628
This is the main resource page for the CEWA/WATS 6628 - Introduction to Action-Effectiveness Monitoring of Riverscape Restoration Projects course offered through Utah State University. This course is part of an advanced series of courses on Low Tech Process Based Restoration (LTPBR) offered through USU and the Riverscapes Consortium. The course is designed to provide hands-on experience with monitoring of riverscapes using QRiS. This course compliments the Introduction to LTPBR Design in the Intro to LTPBR Spring Series and most directly follows on to concepts in the Advanced LTPBR Planning (CEWA/WATS 6626) course.
Description: Students learn how to monitor and assess riverscape health through a mix of desktop and field work. They conduct assessments in Riverscapes Studio, publish their findings, and present to peers.
This page appears here on the QRiS documentation site as QRiS users may find it helpful for self-guided learning.
CEWA/WATS 6628 - Syllabus
Fall 2025 - Syllabus on LTPBR USU Site.
Community
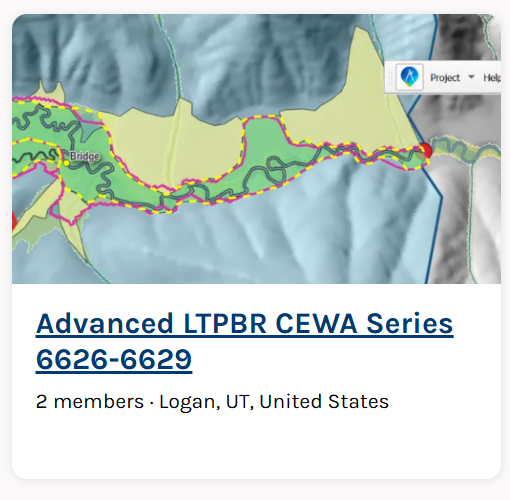
Community Page on Riverscapes Consortium for Advanced LTPBR CEWA Series 6626-6629
Event Page for 2025 Course
Event Page with Meeting Joining Details
Prerequisites and Preparing for Class
Background or Catch-Up Reading
The course is built around monitoring of riverscapes, and seeks to monitor metrics that relate to riverscape health. In Wheaton et al. (2019) and Glassic et al. (2025), Principles of Riverscape Health are introduced that form the basis for understanding how to monitor riverscapes.
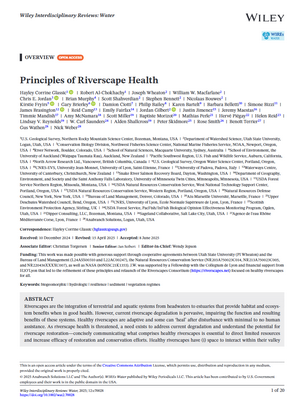
- Glassic, H. C., Al-Chokhachy, R., Wheaton, J., Macfarlane, W. W., Jordan, C. E., Murphy, B., et al. (2025). Principles of Riverscape Health. WIREs Water, 12(4), e70028. DOI:10.1002/wat2.70028
As one example of one set of metrics related to one principle of riverscape health (hydrologic ineffiency is healthy) we refer you to Bartelt et al. (2025) based on the Riverscapes Innundation Mapping protocol:
- Bartelt, K. M. (2025). Mapping valley bottom inundation patterns from beaver dam activity: A potential proxy for hydrologic inefficiency. PLOS Water, 4(11), e0000428. DOI: 10.1371/journal/pwat.0000428
We assume you have read and are familiar with Chapter 2 and Chapter 3 of the Design Manual. This was assigned in WATS 5623/CEWA 5623, but if you have not taken that course, please read it now. If you have not taken WATS 5623/CEWA 5623, you should watch the self-paced lecures.
- Wheaton, J.M., Bennett, S.N., Bouwes, N., Camp, R., Maestas, J.D., and Shahverdian, S.M. 2019. Chapter 2 – Principles of Low-Tech Process-Based Restoration. In: J.M. Wheaton, S.N. Bennett, N. Bouwes, J.D. Maestas and S.M. Shahverdian (Editors), Low-Tech Process-Based Restoration of Riverscapes: Design Manual. Utah State University Wheaton Restoration Consortium, Logan, Utah. 30 pp. DOI: 10.13140/RG.2.2.34270.69447
- Bennett, S., Wheaton, J., Bouwes, N., Shahverdian, S., Macfarlane, W.W., and Portugal, E. 2019. Chapter 3 – Planning for Low-Tech Process-Based Restoration. In: Wheaton, J.M., Bennett, S., Shahverdian, S., Maestas, J.D. (Editors), Low-Tech Process-Based Restoration of Riverscapes: Design Manual. Utah State University Wheaton Ecogeomorphology & Topographic Analysis Lab, Logan, UT. 57 pp. DOI: 10.13140/RG.2.2.15815.75680
This course will be focused on how we quanatitative use monitoring, mapping and analysis in QRiS to build off of the concepts from the Intro to LTPBR course and Intro to LTPBR Planning course:
Details
Papers & Chapters to read before class
Glassic et al. (2025) Principles of Riverscape Heatlh
Recent synthesis and review of Principles of Riverscape Health.
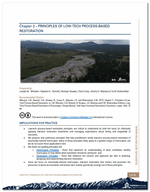
Chapter 2 – Principles of Low-Tech Process-Based Restoration
First introduction of Principles of Riverscape Health into literature.
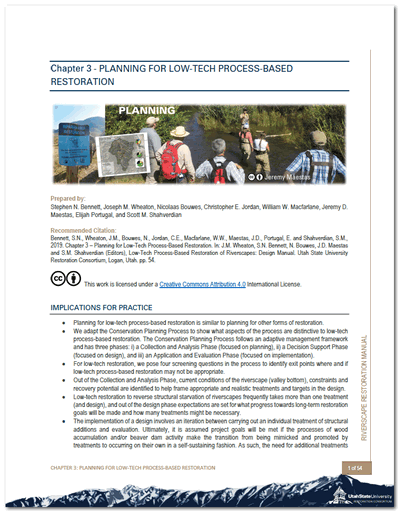
Chapter 3 – Planning for Low-Tech Process-Based Restoration
Introduction to setting objectives and doing resource inventory and analysis for LTPBR projects - precursor to what and why you would monitor in riverscapes.
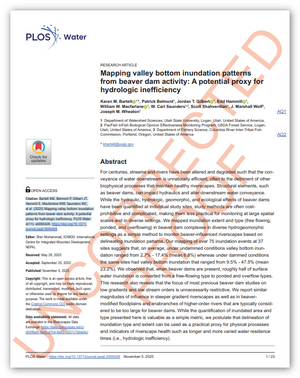
Bartelt et al. (2025)
Mapping valley bottom inundation patterns from beaver dam activity: A potential proxy for hydrologic inefficiency.
Lecture Modules to Review from Intro to LTPBR Planning Course
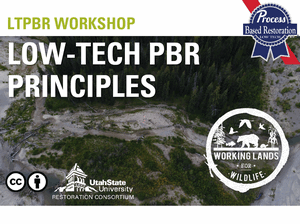
Moudle 1J
Low-Tech PBR Principles
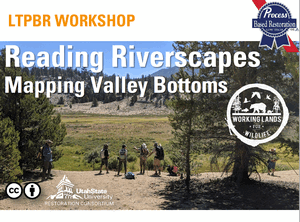
Moudle 3C
Reading Riverscapes & Mapping the Valley Bottom
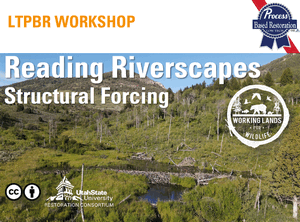
Moudle 3D
Mapping and Estimating Structural Forcing
Moudle 3E
Resource Inventory & Analysis - Risk Assessment, Condition Assessment & Recovery Space
Moudle 3F
Connecting & Clarifying Objectives & Tying to Goals
Moudle 4F
Putting it all together in the field
Software Requirements
- Install QGiS and the QRiS and Riverscapes Viewer Plugins (see here).
If you did not take the planning course, please review the software installation instructions and ensure you have QGiS, the QRiS plugin, and the Riverscapes Viewer plugin installed and working before the first day of class. If you need help with this, please show up on Monday morning at 8:45 AM instead of 9:00 AM.
Main Assignment
The main outcome of this workshop is to complete a riverscape health monitoring analysis with multi-temporal monitoring at a site. For this class, you will only be expected to complete this for data we provide and you create at Spawn Creek.
You will:
- Prepare new data capture events for Spawn Creek for imagery from 2006, 2021 and 2024. You will digitize beaver dams using basemaps provided to you. For extra credit (or a good feeling), you can figure out how to do a fourth DCE From 2025 in Google Earth and import it. Digitize beaver dam locations using the Structural Element survey in the LTPBR V2 Protocol in each DCE.
- Combining your data capture events with those we provided to you (from 2011, 2014, 2016 & 2017), perform an analysis of beaver dam activity for all of Spawn Creek as well as broken into discrete reaches. You will calculate the following metrics for each time period and changes between time periods:
- Number of dams
- Density of dams (dams/km)
- Change in number of dams
- Change in density of dams Produce maps, tables and graphs to present your findings.
- Create a small report as a PDF, and added as an attatchment to your Riverscapes Studio Project. Your report should follow a standard format (Introduction, Methods, Results, Discussion, Conclusions, References) and include:
- Introduction: Brief introduction to the site and why monitoring beaver dams is important to riverscape health.
- Methods: Description of how you created your DCEs, how you digitized dams, and how you calculated metrics.
- Results: Maps, tables and graphs of your findings.
- Discussion: Interpretation of your results. What do they mean for riverscape health at Spawn Creek? What are the limitations of your analysis?
- Conclusions: Summary of key findings and their implications for future monitoring and management at Spawn Creek.
- References: Cite any sources you used in your report.
- Upload your analysis as a QRiS Project by exporting as Riverscapes Studio Project and publish to the Data Exchange.
- Present a 5 minute presentation on Thursday of your findings to the class.
- Post a link to your presentation and Riverscapes Studio Project in the Riverscapes Consortium Community.
Resources
Class Recordings
Details
Our morning sessions are recorded for your reference.
Monday
Forthcoming - Will post after class.
Tuesday
Forthcoming - Will post after class.
Wednesday
Forthcoming - Will post after class.
Thursday
Forthcoming - Will post after class.
Community Resources
These communities from the Riverscapes Consortium are great places to ask questions, connect with colleagues and share your work.
Advanced CEWA LTPBR Series Community
The community for connecting with others in this class and the advanced series of Adavanced LTPBR courses.
Riverscapes Studio Users
Community of QRiS Users. Stay up to date on latest releases, webinars, trainings, ask questions and share your work.
LTPBR of Riverscapes - Practitioner Community
This community is intended to facilitate exchange between practitioners of LTPBR anywhere in the world.
Assignment Resources
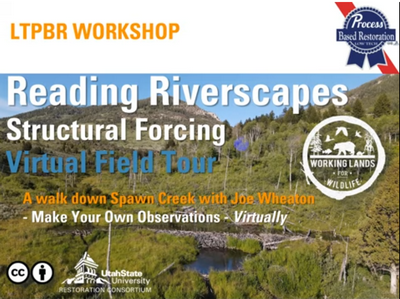
Reading Riverscapes - Spawn Creek
A virtual field tour of Spawn Creek to help you get familiar with the site.
In Class Exercises
Data for Exercises
You are welcome to download these projects as we use them in class, or download them all ahead of time. We suggest downloading them somewhere easy to navigate to (and making a favorite shortcut to that folder in QGIS) such as c:/0_RS/CEWA6628/.
Also, the cards below generally link to collections of Riverscape Studio Projects in the Riverscapes Data Exchange with two or more projects. There tends to be larger projects with all the base imagery, and smaller projects without. For most exercises, you only need the smaller "exercise" projects. The "final" projects are provided for reference.
QRiS Example Projects
Spawn Creek
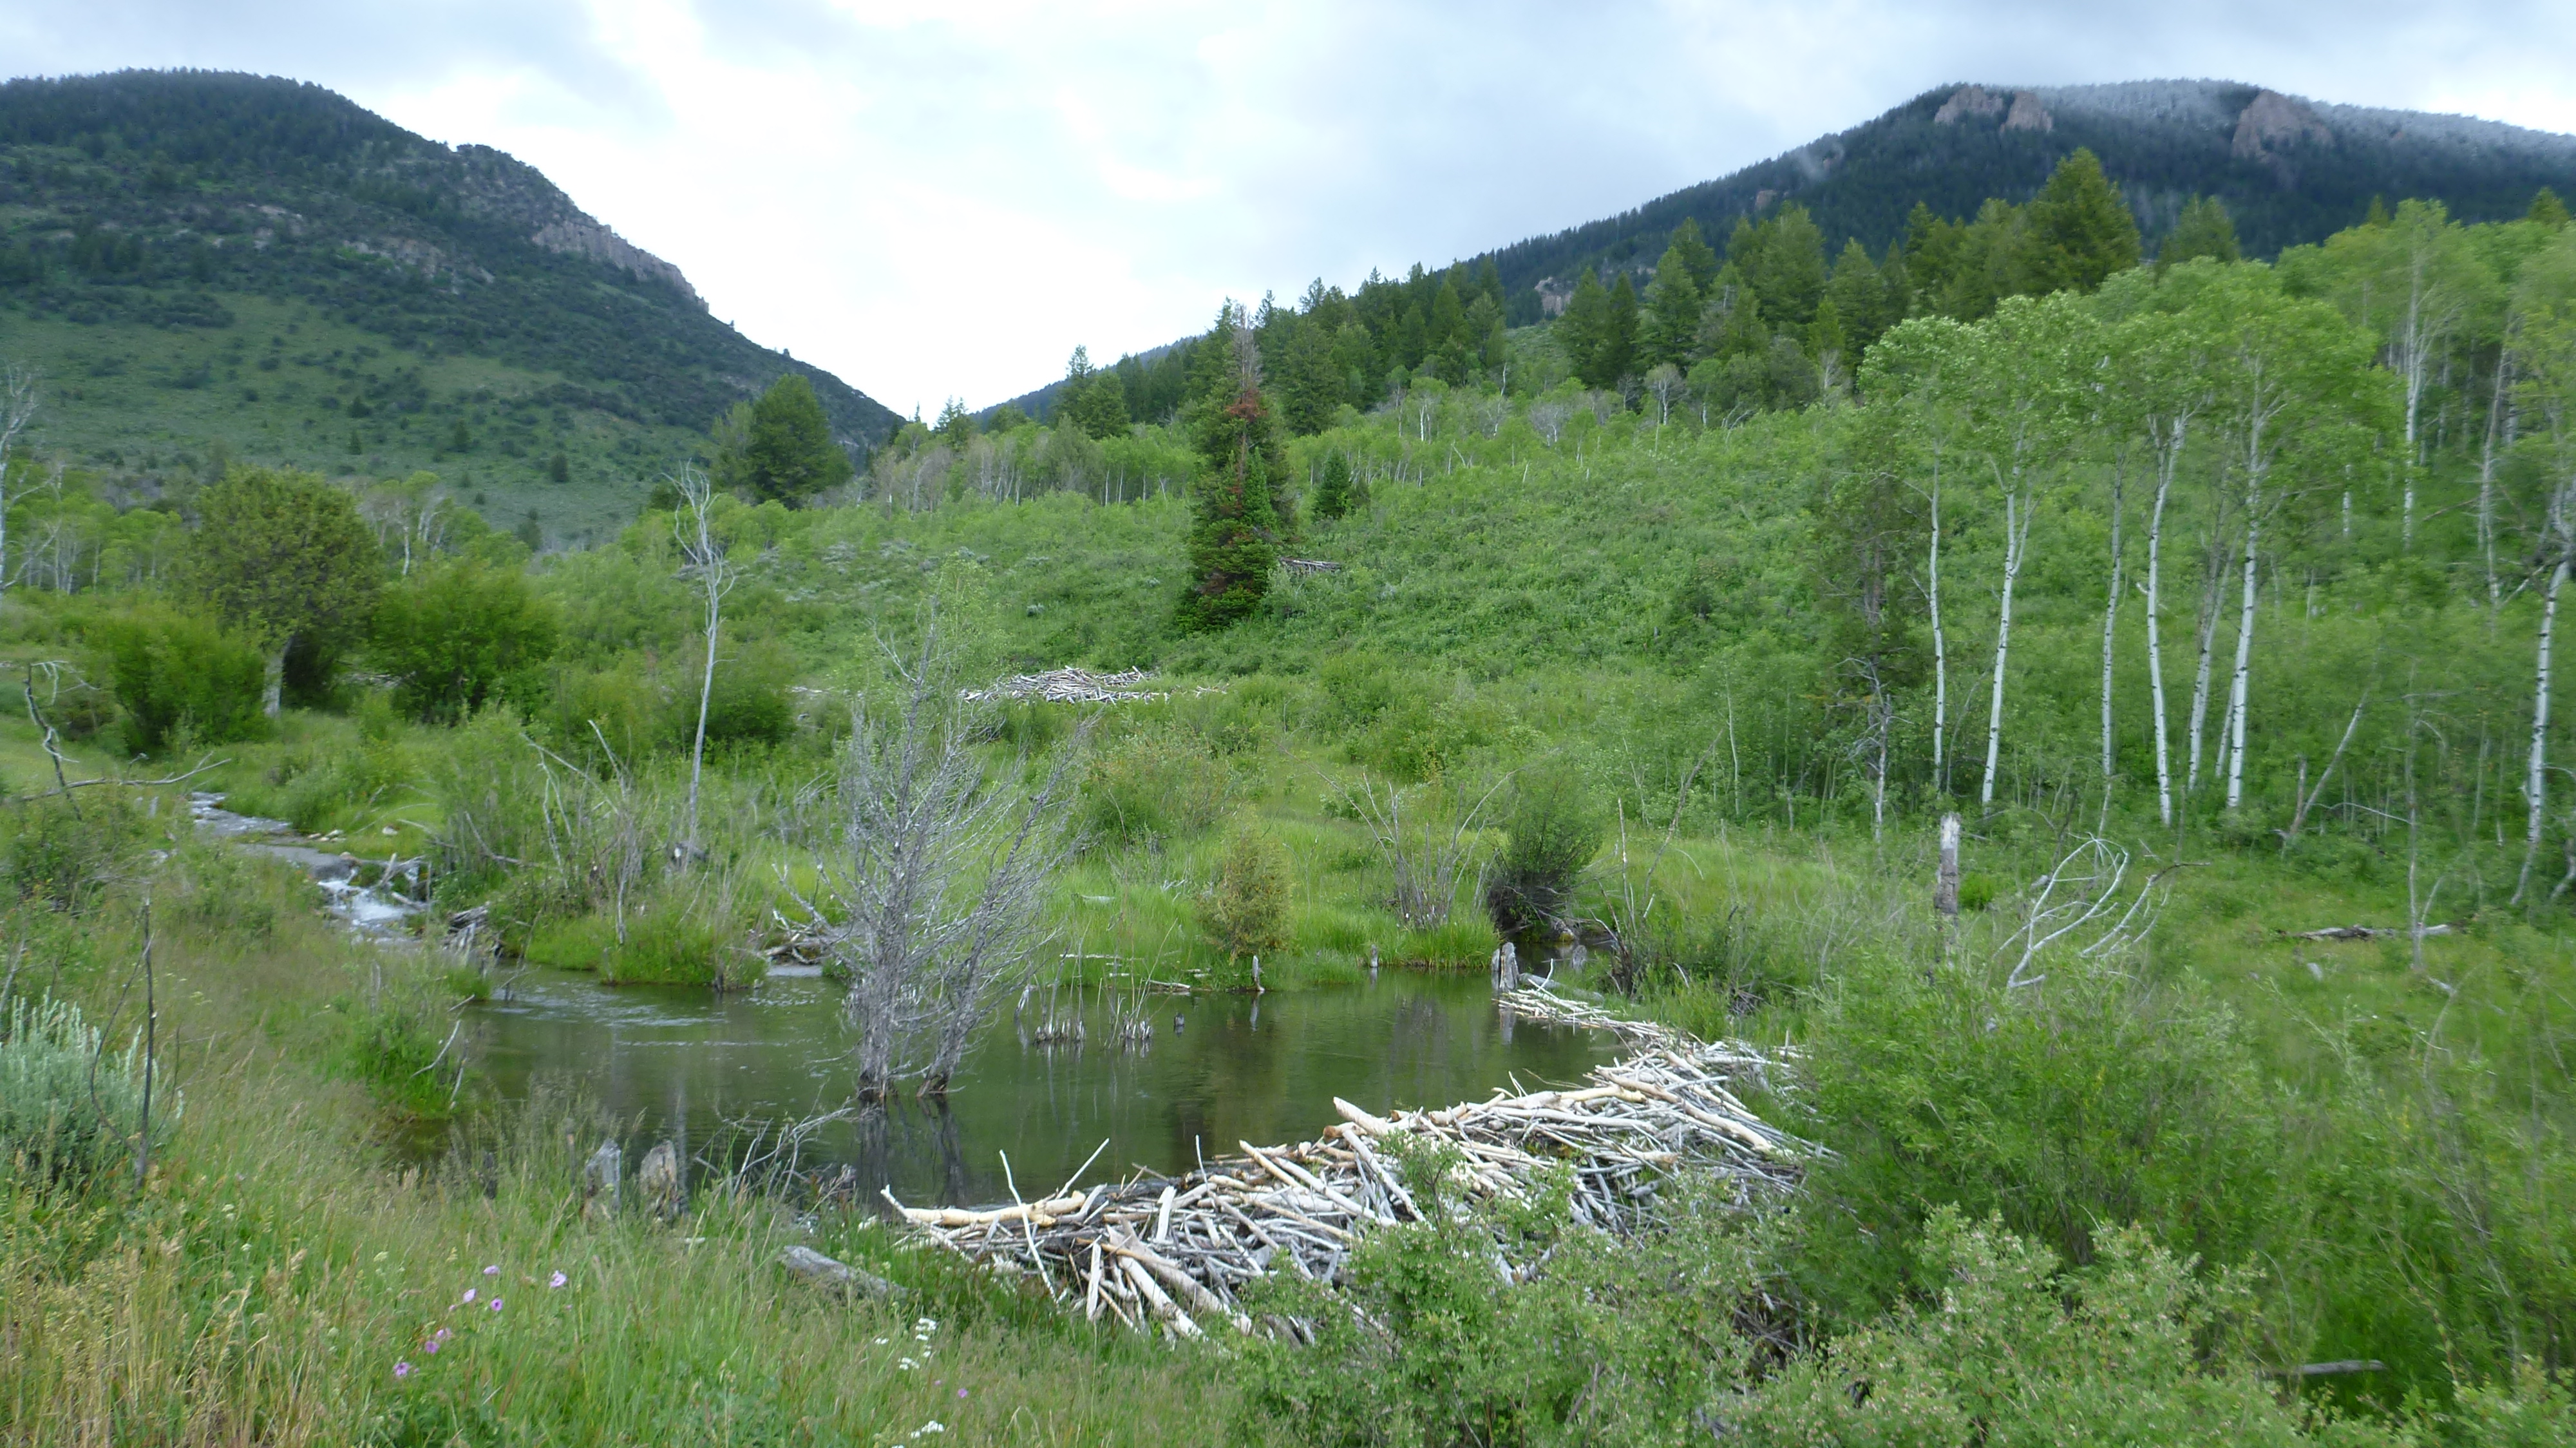
Demo project on Spawn Creek (tributary to the Logan River) in Northern Utah. This project was created to track beaver dams over time after the introduction of a cattle exclosure fence in 2006. This is an example of a passive LTPBR project where the combination of a change in grazing management with a beaver trapping closure was the restoration action.
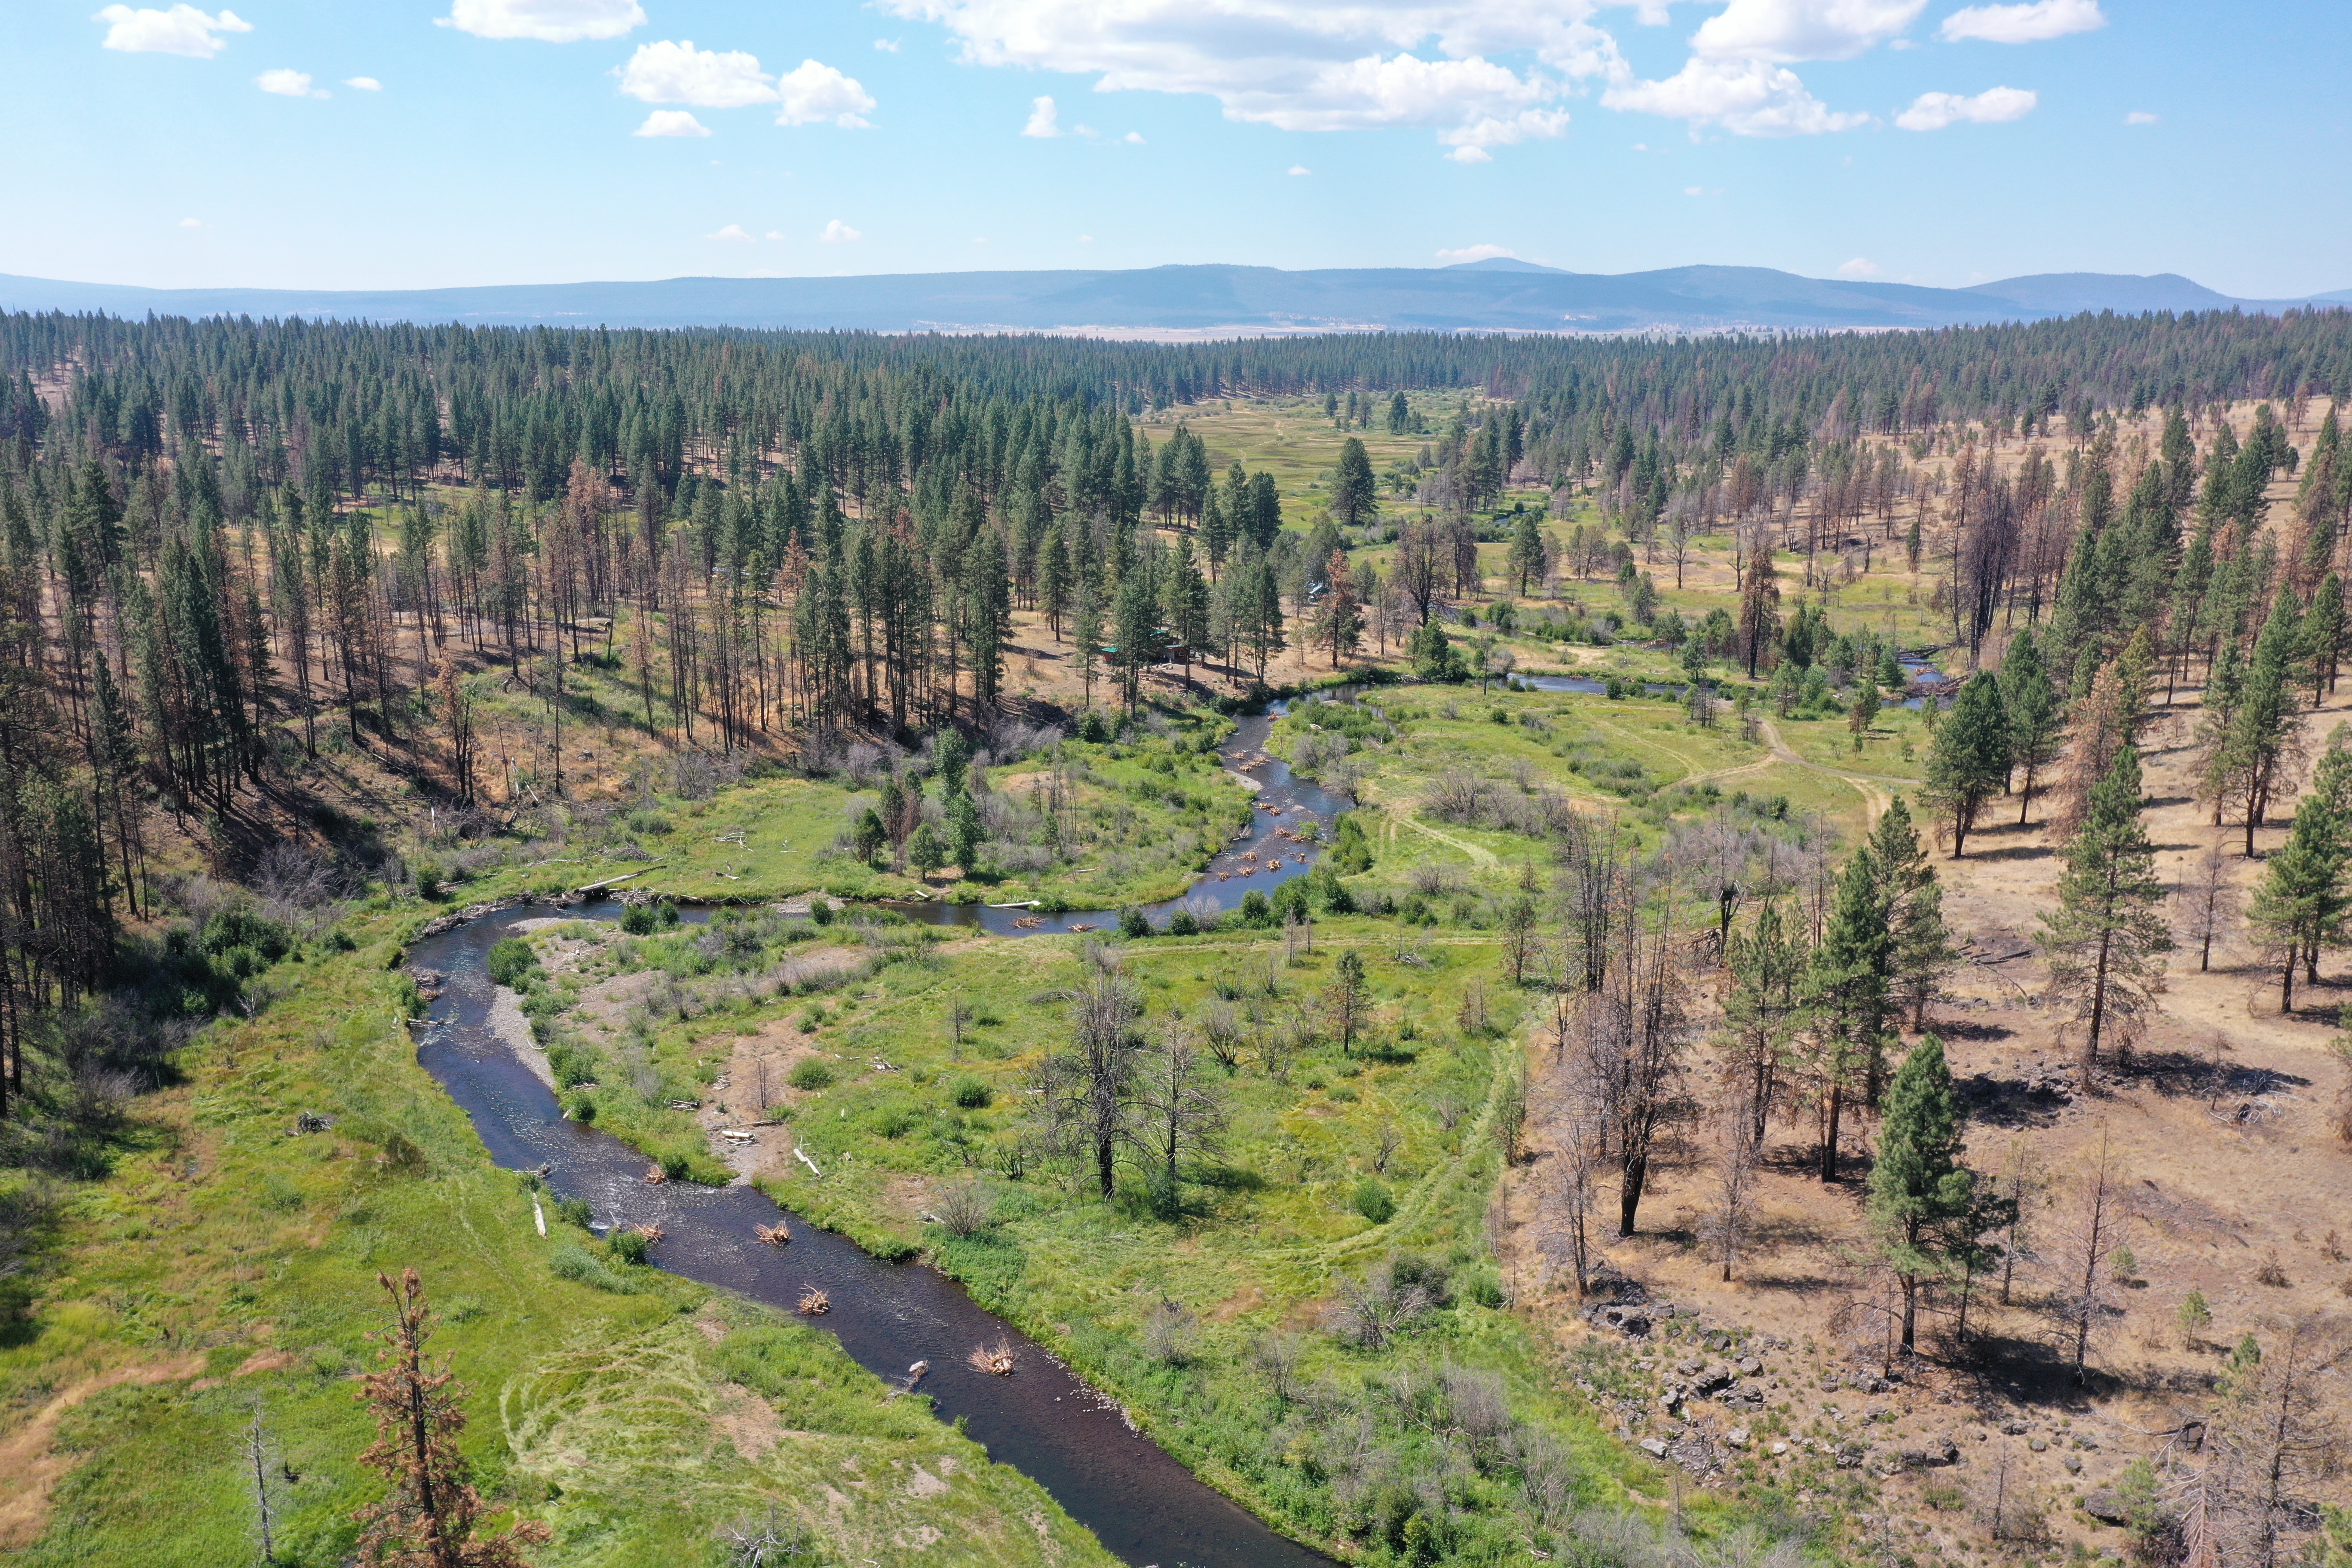
Bailey Flat
Demo project in South Central Oregon. This multiphase project was created to show how multiple DCEs from monitoring efforts result in an analysis of metrics.
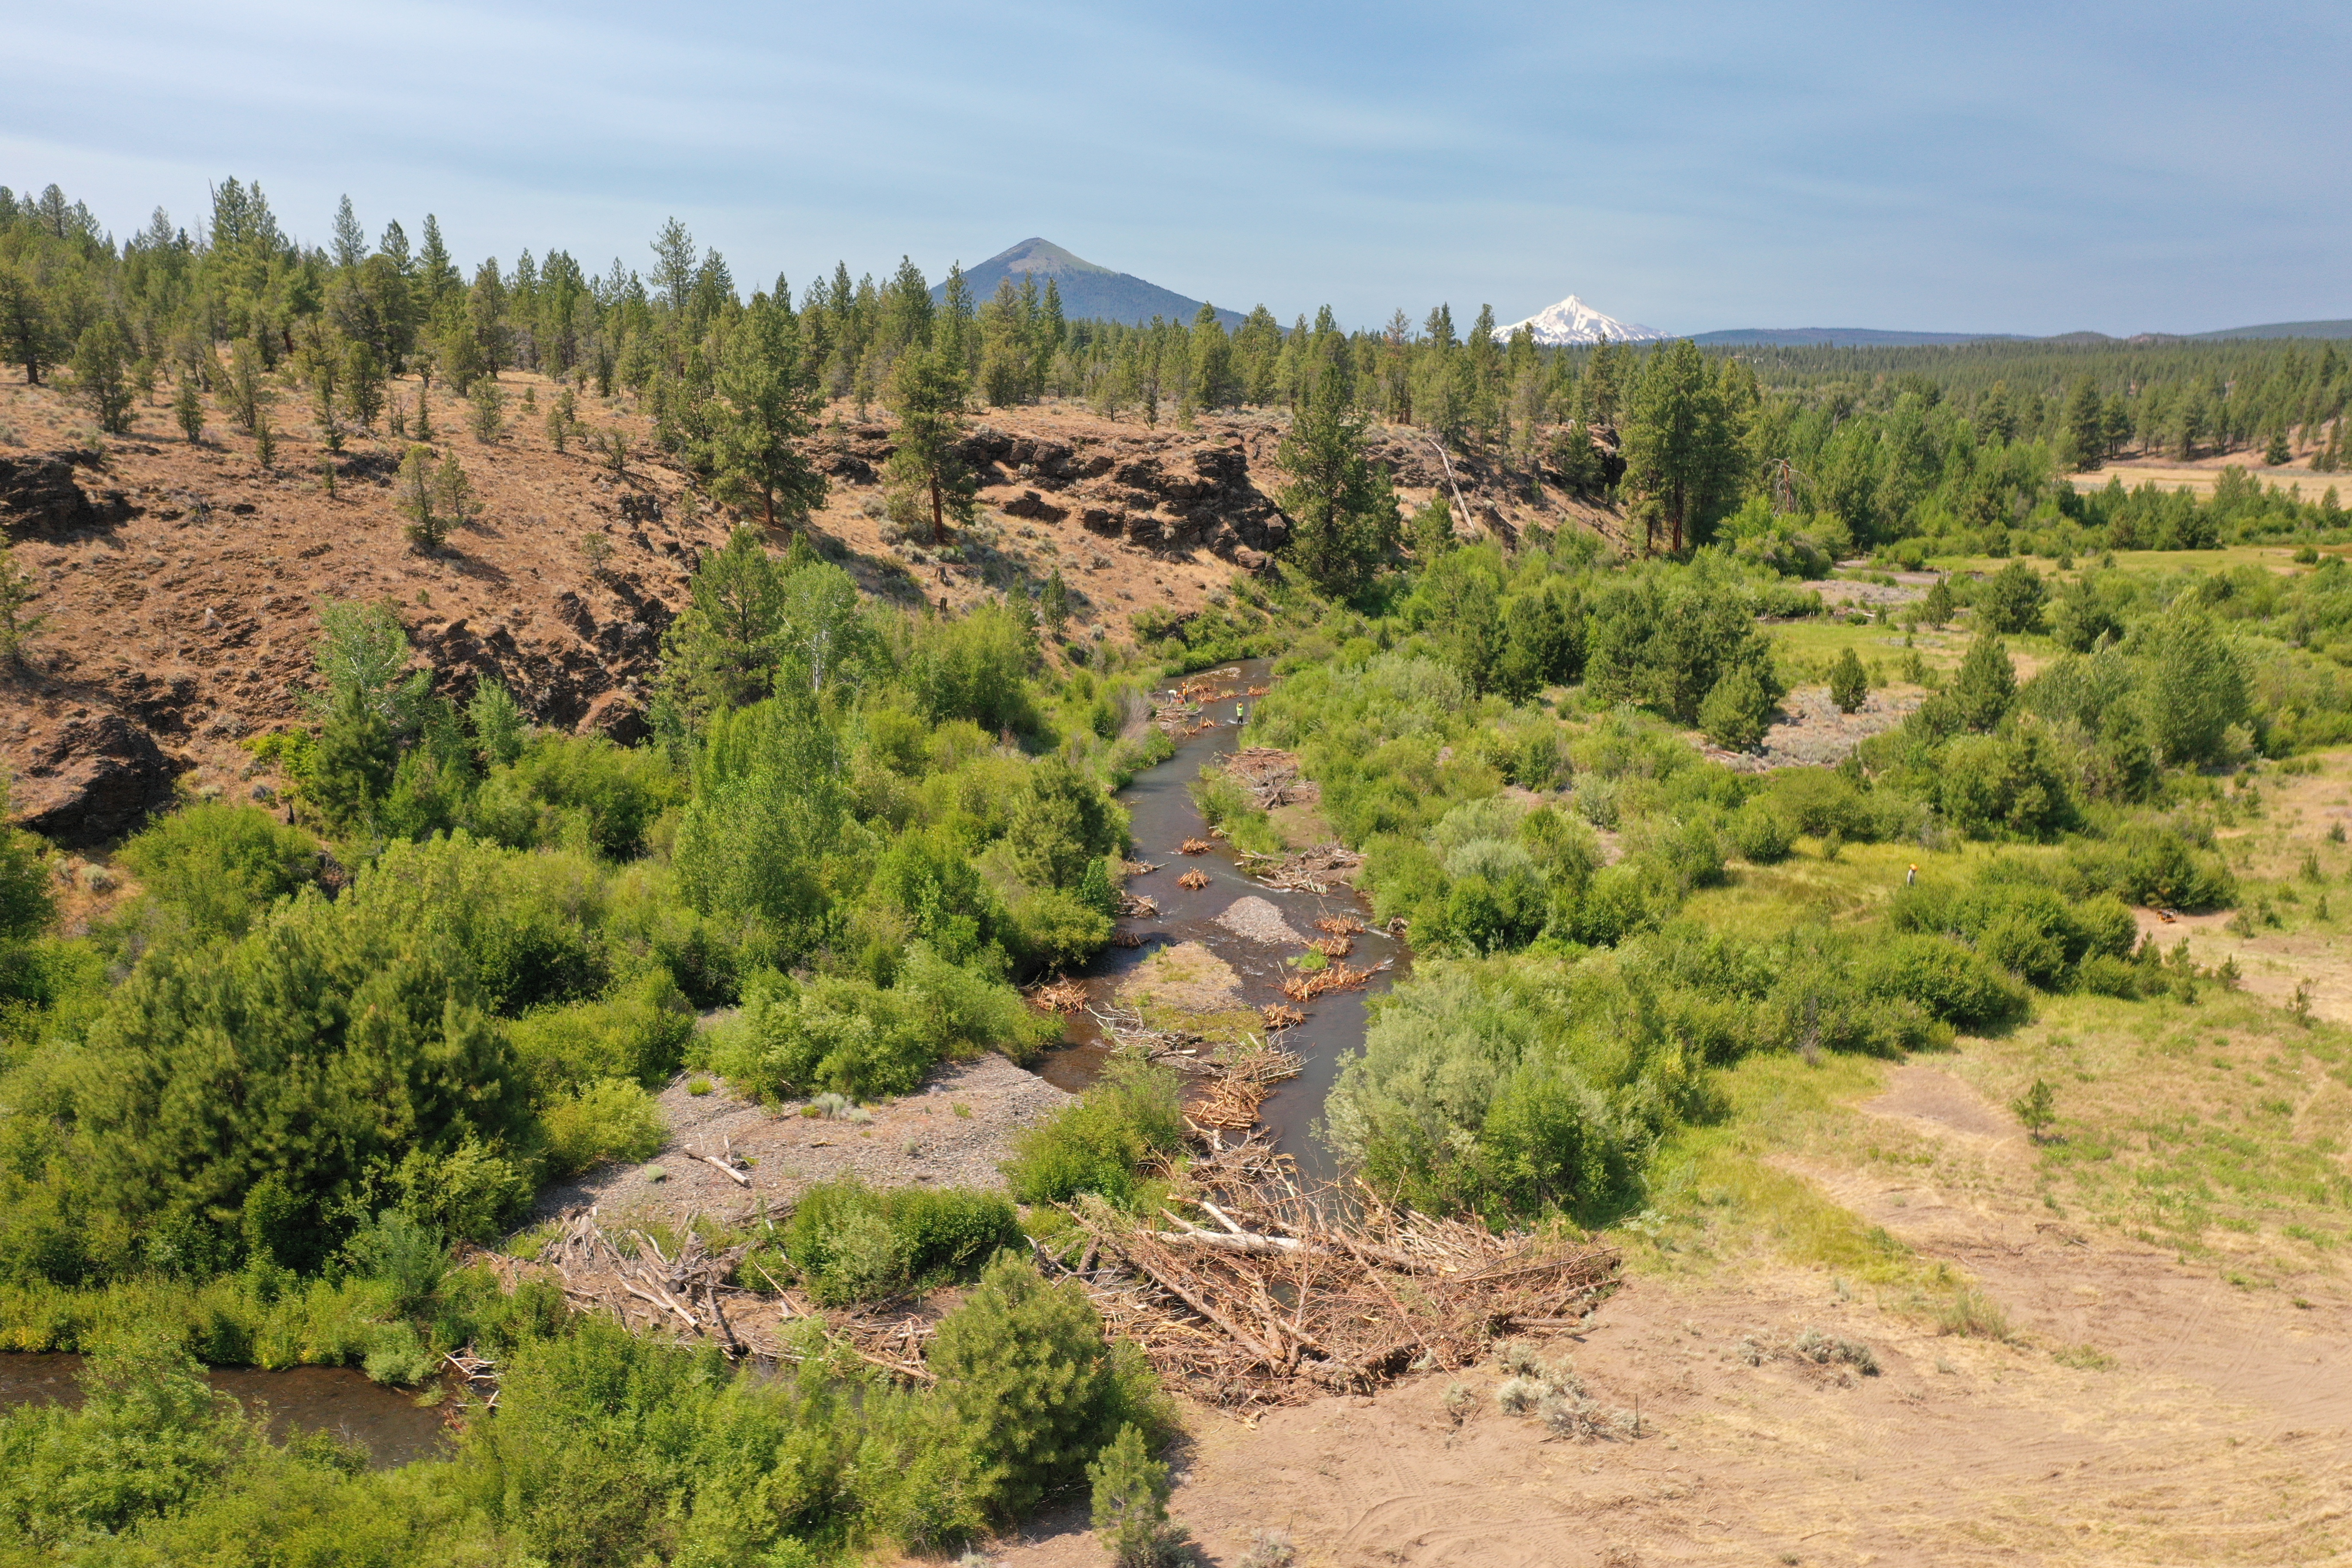
Willow Springs
Demo project on Wychus Creek in Sisters, Oregon. This project was curated to explore how QRIS stores and organizes multiple phases of Designs, As-Builts, and DCEs.
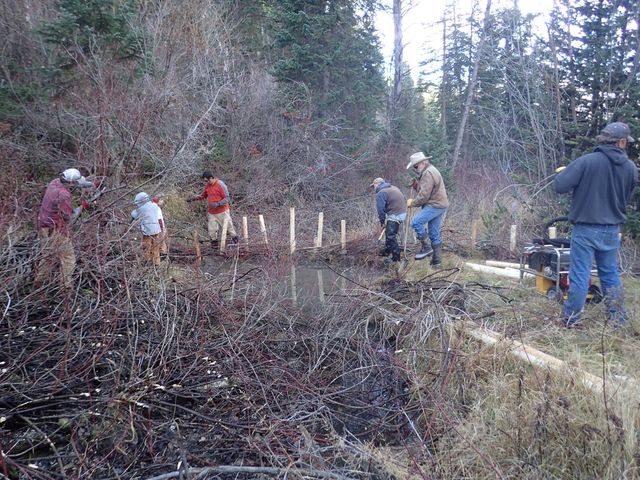
Birch Creek
Demo Project in Southern Idaho. This project spans many years with the goal of using beaver to return perennial flow to Birch Creek, a simple but effective example of organizing data and keeping track of a timeline in QRIS.
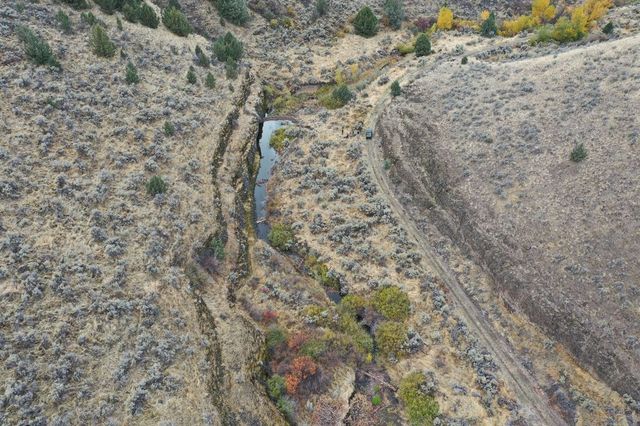
Upper Thirtymile
Monitoring project in Northeastern Oregon. This project was created to assess riverscape features from aerial imagery in June of 2019 and October of 2020 and compare riverscape changes at two reach locations (Irzik to Badger Canyon and Comstock Basin) after implementation in 2022.
Upper Bear
Demo project on Upper Bear watershed in northeastern Utah. This demo project shows different forms of monitoring at reach and watershed scales to calculate riverscape metrics.
1. Quick Introduction to using QRiS - Example of Birch Creek
Birch Creek Exercise 1 (new project, digitize dams, SF, analysis)
Here we are going to dive right in without any real explanation, just to get you working inside QRiS. Download the Birch Creek without Imagery - Project from the Data Exchange and load it in QRiS within QGIS.
Birch Creek
Demo Project in Southern Idaho. This project spans many years with the goal of using beaver to return perennial flow to Birch Creek, a simple but effective example of organizing data and keeping track of a timeline in QRIS.
- Click on QRIS logo and select Project >
+ New QRIS Project. Give it a name and save location and click ok. - Right click on Data Capture Events node and select
+ Add New Data Capture Event. In the dialog box that pops up do the following:- Give the DCE a name
- Make sure the box next to SHow Experimental Protocols is checked.
- In Available Layers locate the Beaver Protocol and select the Beaver Dam Survey layer and click Add.
- Click OK.
- Right click the Beaver Dam Survey layer and select
Add to map. - Begin an edit session and start digitizing dam locations and fill out the form that pops up for each poin to add information about the dam at each digitized location. When finished save the edits.
- Right click on the Riverscapes node and select
Create New (manually digitized) Valley Bottom. Add that layer to the map and begin an edit session and digitize a Valley Bottom that encompasses all the dams you previously digitized. - Right click on the Analyses node and select
+ Add New Anlysis. Give it a name, select your previously digitized valley Bottom as the Analysis Mask. Set all metrics and indicators to None using the button in the bottom right. Then find the Total Dam Count metric and change it from none to Metric. ClickOkto open the analysis form. - Click
Calculateand leave the defaults in the pop up window and click ok to calculate dam cout within your valley bottom that was used as the sample frame.
2. Review of River & Riverscape Monitoring Concepts
Indicator Template Resources
An example template based on Table 3.1 on page 8 of Chapter 3 of the LTPBR Design Manual. is provided below.
| Resource Type | Suggested Resource Link | Notes or Alternative Resource |
|---|---|---|
| Project Indicator Template | Condition Worksheet.xlsx | This is an excel template worksheet for populating active channel, active floodplain, vs. inaccessed floodplain mapping of your valley bottom as a means of cataloging condition and estimating recovery space and constraining design. To the extent possible, you will be using QRiS Analyses to populate these tables (one for every sample frame or reach). |
Overview of Project Indicator Template
This 7 minute video gives an over of the condition worksheet (from Capstone class and different example project).
Warning, most people grasp the idea of choosing the rows for this table (i.e. metrics and indicators) fairly quickly. They then realize that planning is essentially three columns of this table: existing conditions, estimated historic (for reference) and estimated future conditions (i.e. recovery space). Most tend to grasp the concept of recovery space being limited by estimated histroic too. What confuses people most is how many tables they will end up with. You have a separate table for every sample frame or area of interest you choose as the spatial extent of your analysis.
Some think, all I need is one table for my entire property or project area. This may be simple and fine in some cases, but it often makes it difficult to differenatiate important spatial differences in condition and recovery space across the project area. This is why we often have multiple sample frames.
3. Review of Riverscape Health
4. Introduction to using QRiS - Example of Birch Creek
Here, we will pick up the same Birch Creek project from Exercise 1, but work more slowly through a LTPBR story and the specific steps so you can start to learn how we can do riverscape health monitoring for an action-effectiveness LTPBR monitoring example.
Of course the real stories of Brich Creek our best told by Jay Wilde, Ben Goldfarb (author of "Eager") and a slough of documentary film makers, reporters and interviewers.
A. Birch Creek Demo and Project Overview (Exercise 2- the story in QRiS format)
B. Birch Creek Exercise 3 (RIM DCE)
- Open the project you created in Exercise 1.
- Right click on the previously created DCE and select
Properties. - Make sure the
Show Experimental Protocolsbox is checked in[Settings](https://qris.riverscapes.net/software-help/toolbar/#settings). - Browse in available layers to the LTPBR protocol and selct the Inudation Extents layer and click Add. Scroll to the River Inundation Mapping protocol and select the Dam Crests layer and click Add. Click OK.
- Individually digitize those two layers.
- Right click on your previously created analysis and click Properties.
- Find the metrics related to ponded, overflow, and free flowing inundation types and change them from None to Metric and click OK.
- Right click the analyis again and select Open Analysis.
- Now you can select Calculate and redo the calculation to calculate the metrics associated with the new layers you just digitized.
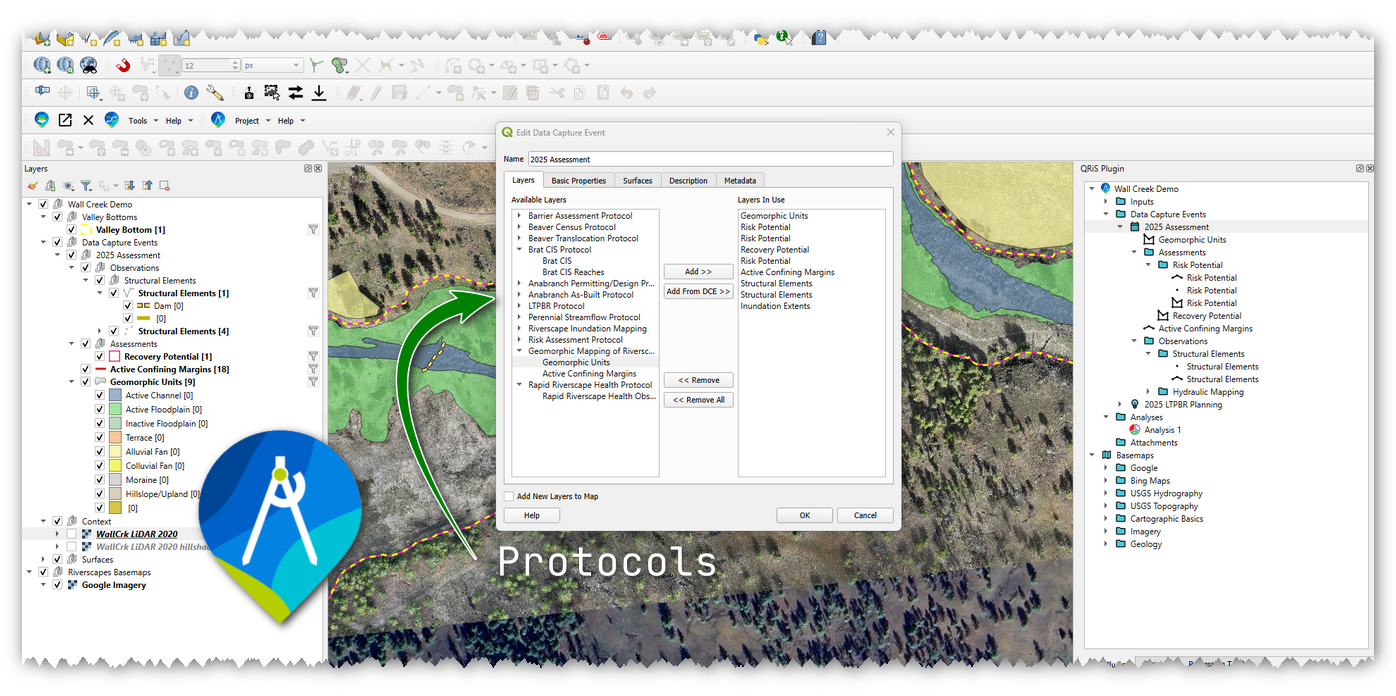
5.Concept of Protocols in QRiS
Protocols can help you and your organization unlock the power of data capture and analysis with QGIS Riverscapes Studio (QRiS).
QRiS provides a flexible and consistent framework for digitizing and managing riverscape data. QRiS is built to help with riverscape analysis, monitoring, assessment, LTPBR design preparation, and capturing as-built LTPBR designs.
Webinar on Protocols in QRiS for more Information
Watch QRiS Webinar on Protocols
September 22, 2025 Webinar - hosted by the Riverscapes Consortium
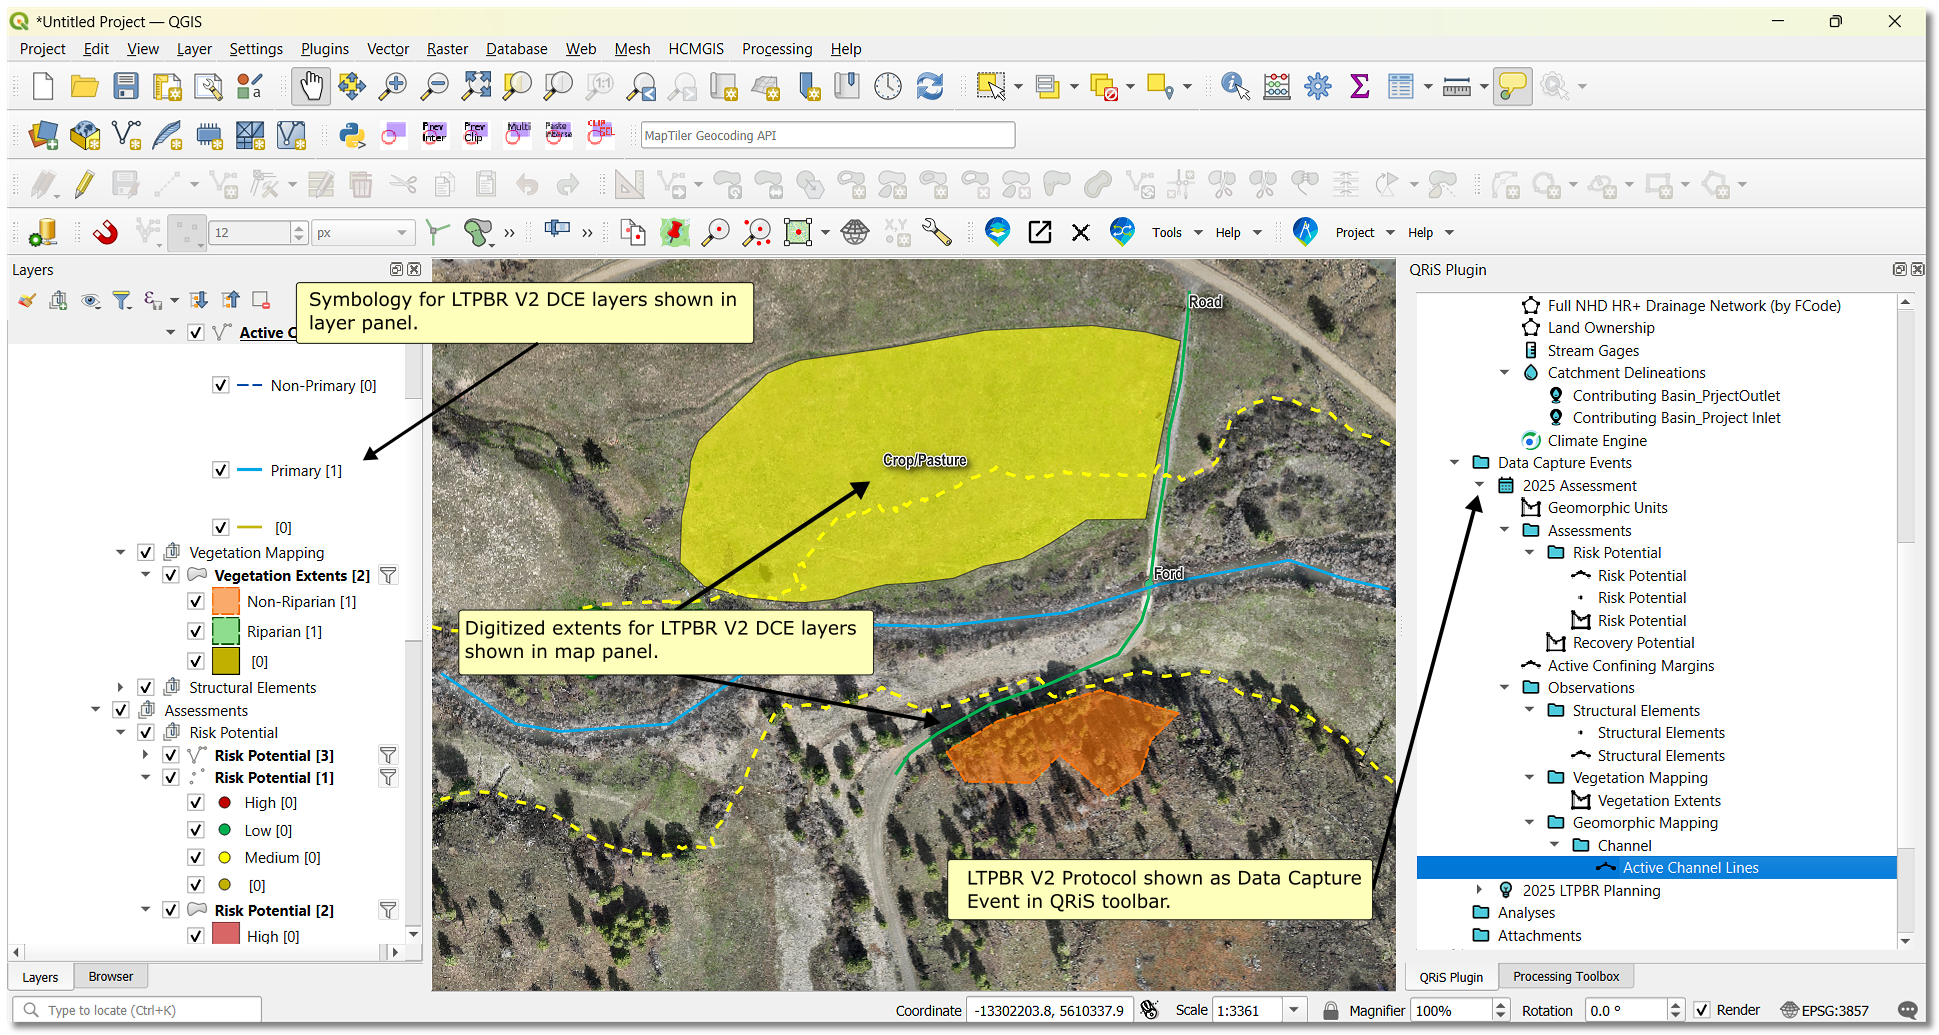
6. LTPBR V2 Protocol Overview
The first protocol that was built into QRiS was the Weber et al. (2024) Low-Tech Process-Based Restoration Design and Monitoring Protocol: Standard Methods for Developing Project Designs and Assessing Riverscape Health. Version 2.0. or LTPBR V2 Protocol. This protocol contains a suite of layers for mapping riverscape features important to LTPBR design and monitoring. **It is not the only way to monitoring riverscape health!*. There are many other protocols available in QRiS including the Riverscape Inundation Mapping Protocol and others that may be more appropriate for your monitoring needs. However, the LTPBR V2 protocol is a good starting point for learning how to monitor riverscape health in QRiS. There is a difference between the "protocol" as it exists in QRiS and the published protocol document.
- Weber N., Wheaton J.M., Shalcross A., Al-Chokhachy R, Bailey P., Bartelt K., Bennett S., Bouwes B., Bouwes N., Gilbert J., Dickard M., Heitke J., Jordan C., Glassic H., MacFarlane W.W., Miller S., Saunders C., Whitehead K. 2024. Low-Tech Process-Based Restoration Design and Monitoring Protocol: Standard Methods for Developing Project Designs and Assessing Riverscape Health. Version 2.0. Prepared by Anabranch Solutions and Utah State University Riverscapes Assessment and Monitoring Lab. Prepared for the Bureau of Land Management. Logan, UT. 81 pp. DOI: 10.5281/zenodo.13769899
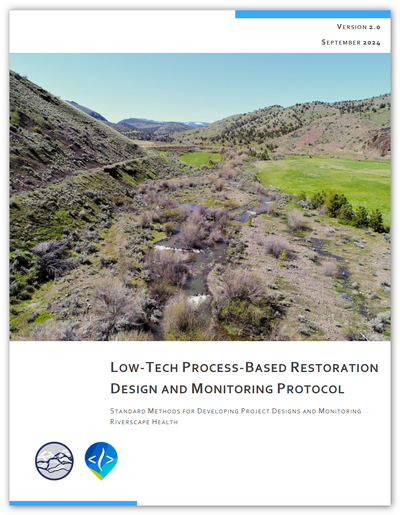
Publication: LTPBR V2 Protocol
The Weber et al. (2024) published protocol document describing the LTPBR V2 methods.
QRiS Protocol: LTPBR V2
The reference page for the LTPBR V2 protocol in QRiS.
We will now use Willow Springs (primarily) to walk through the different aspects of the protocol.
7. Working through LTPBR V2 Protocol with Willow Springs
Willow Springs
Demo project on Wychus Creek in Sisters, Oregon. This project was curated to explore how QRIS stores and organizes multiple phases of Designs, As-Builts, and DCEs.
Details
Willow Springs Through Time
Some drone footage of Willow Springs through time showing the changes in the riverscape after LTPBR implementation. After Phase 1:After Second Flood following Phase 1:
After Phase 2:
A. Channel Junction Mapping
B. Active Channel Lines Mapping
C. Active Channel Extents Mapping
D. Structural Elements Mapping
E. Dam Crest Mapping
F. Jam Area Mapping
G. Inundation Extents Mapping
H. Vegetation Extents Mapping
I. Active Extents Mapping
J. Geomorphic Units Mapping
K. Final LTPBR mapping Overview
8. Other Examples
Below we will use a mix of different examples from other projects to highlight different aspects of LTPBR action-effectiveness monitoring. For a little more information on these proejcts, see this presentation from Anabranch Solution's Gus Wathen, in wihch he provides an overview of many of these projects.
Bailey Flat
Bailey Flat
Demo project in South Central Oregon. This multiphase project was created to show how multiple DCEs from monitoring efforts result in an analysis of metrics.
Details
Bailey Flat in Flood Following Phase 2
Some drone footage of Bailey Flat through time showing the changes in the riverscape after two rounds of LTPBR implementation.Upper Bear
Upper Bear
Demo project on Upper Bear watershed in northeastern Utah. This demo project shows different forms of monitoring at reach and watershed scales to calculate riverscape metrics.
Upper Thirtymile
Upper Thirtymile
Monitoring project in Northeastern Oregon. This project was created to assess riverscape features from aerial imagery in June of 2019 and October of 2020 and compare riverscape changes at two reach locations (Irzik to Badger Canyon and Comstock Basin) after implementation in 2022.
9. Spawn Creek Final Assignment & Exercises
Spawn Creek
Demo project on Spawn Creek (tributary to the Logan River) in Northern Utah. This project was created to track beaver dams over time after the introduction of a cattle exclosure fence in 2006. This is an example of a passive LTPBR project where the combination of a change in grazing management with a beaver trapping closure was the restoration action.
Reading Riverscapes - Spawn Creek
A virtual field tour of Spawn Creek to help you get familiar with the site.