Advanced LTPBR Planning
Overview to CEWA/WATS 6626
This is the main resource page for the CEWA/WATS 6626 - Advanced LTPBR Planning course offered at Utah State University. This course is part of an advanced series of courses on Low Tech Process Based Restoration (LTPBR) offered through USU and the Riverscapes Consortium. The course is designed to provide hands-on experience with LTPBR planning using QRiS and is a direct follow up to the Introduction to LTPBR Planning in the Intro to LTPBR Spring Series.
Description: Advanced course in site-scale planning of LTPBR projects using Riverscapes Studio. Students will assess current, historic and potential future conditions of riverscape health to prepare for design.
This page appears here on the QRiS documentation site as QRiS users may find it helpful for self-guided learning.
CEWA/WATS 6626 - Syllabus
Fall 2025 - Syllabus on LTPBR USU Site.
Community
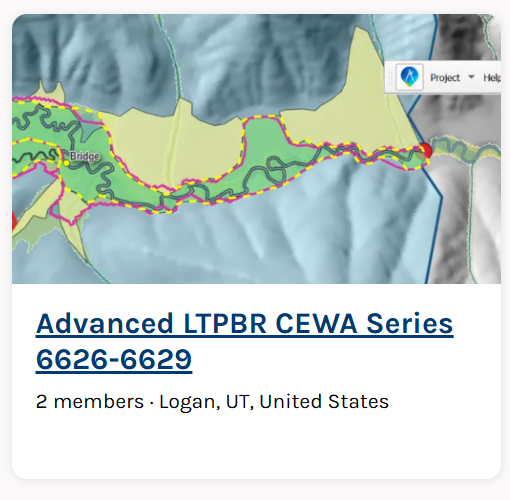
Community Page on Riverscapes Consortium for Advanced LTPBR CEWA Series 6626-6629
Event Page for 2025 Course
Event Page with Meeting Joining Details
Prerequisites and Preparing for Class
Background or Catch-Up Reading
We assume you have read and are familiar with Chapter 3 of the Design Manual. This was assigned in WATS 5622/CEWA 5622, but if you have not taken that course, please read it now. If you have not taken WATS 5622/CEWA 5622, you should watch the self-paced lecures.
This course will be focused on how we quanatitative use mapping and analysis in QRiS to build off of these concepts from the Intro to Planning course:
Moudle 3C
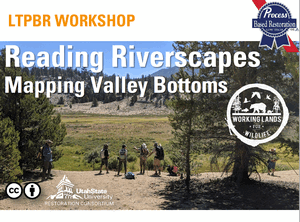
Reading Riverscapes & Mapping the Valley Bottom
Moudle 3D
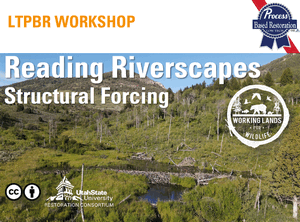
Mapping and Estimating Structural Forcing
Moudle 3E
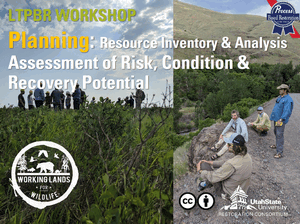
Resource Inventory & Analysis - Risk Assessment, Condition Assessment & Recovery Space
Moudle 3F
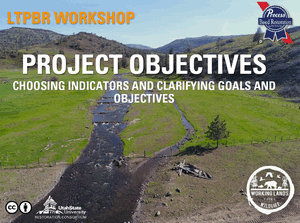
Connecting & Clarifying Objectives & Tying to Goals
Software Requirements
- Install QGiS and the QRiS and Riverscapes Viewer Plugins (see here).
Main Assignment
The main outcome of this workshop is to complete a LTPBR Planning Analysis for a project reach of your choosing using QRiS.
You will:
- Complete a Riverscapes LTPBR Planning Report (through planning section of template) with your supporting maps and analyses using QRiS. This report will be saved as a PDF, and added as an attatchment to your Riverscapes Studio Project.
- Create a QRiS Project, and export a Riverscapes Studio Project and publish to the Data Exchange.
- Create a PBR Explorer Project Entry for Proposed Work. You can optionally make this private and part of a Data Exchange Organization you create that you give instructor access to.
- Present a 10 minute presentation on Thursday of your project to the class.
- Post a link to your presentation and Riverscapes Studio Project in the Riverscapes Consortium Community.
Yes, you can build off what you started. For those of you that completed the WATS/CEWA 5622 Introduction to Planning Course, you will already have chosen a site, and have the start of a report. It is perfectly reasonable to pick up the old report and the same site and just re-do and expand a more througough analysis and planning report using QRiS. It is also accepable to pick a new site and start fresh.
Those that have not taken WATS 5622 or did not complete that course assignment, will need to pick a site and write a report from scratch.
Formative Exercise - Sharing your proposed site
Submit your proposed site as Private PBR Explorer Project
Everyone will submit their proposed site as a Private PBR Explorer Project to a Data Exchange Organization we create and give you all access to. We will do this as in-class demo together on Monday.
We will regroup at 3:15 PM on Monday to share your proposed sites and give feedback to each other on site selection.
Homework
Due Tuesday
Today we covered how to create your own QRiS project, how to create an area of interset within it, how to bring datasets from Riverscapes Projects into your project, and how to read and map a riverscape. For homework, show up tomorrow with a QRiS project for your LTPBR Site populated with:
- An AOI of your "project area"
- At least one Catchment delineated from the bottom of your project area
- At least one Catchment promotoed to an AOI
- A current Data Capture Event with
- Valley geomorhpic units mapped
- Active confining margins mapped
- At least one riverscape (valley bottom) representing your mapping
- A VBET derived riverscape clipped to your project area
- Centerlines for both your riverscapes (manual and VBET)
- Some context layers clipped to your watershed or AOI
Resources
Class Recordings
Details
Our meetings were recorded for your reference.
The playlist is organized by day. We missed a few bits here and there where we forgot to start recording, but the vast majority is there.
Community Resources
These communities from the Riverscapes Consortium are great places to ask questions, connect with colleagues and share your work.
Advanced CEWA LTPBR Series Community
The community for connecting with others in this class and the advanced series of Adavanced LTPBR courses.
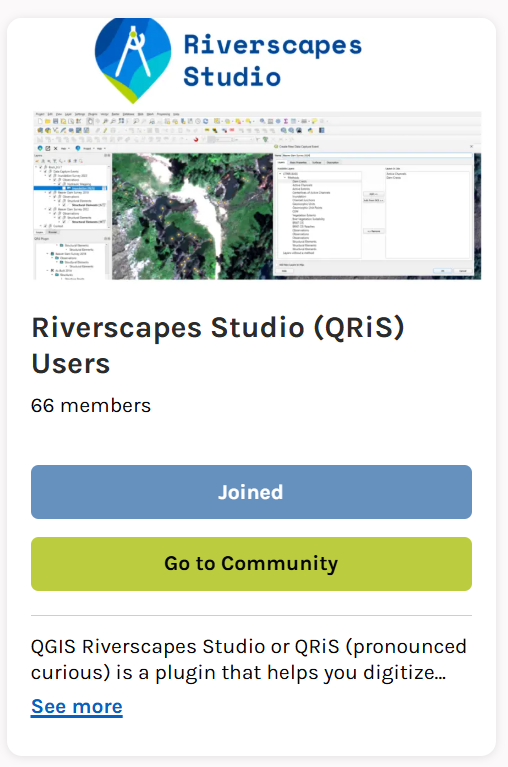
Riverscapes Studio Users
Community of QRiS Users. Stay up to date on latest releases, webinars, trainings, ask questions and share your work.
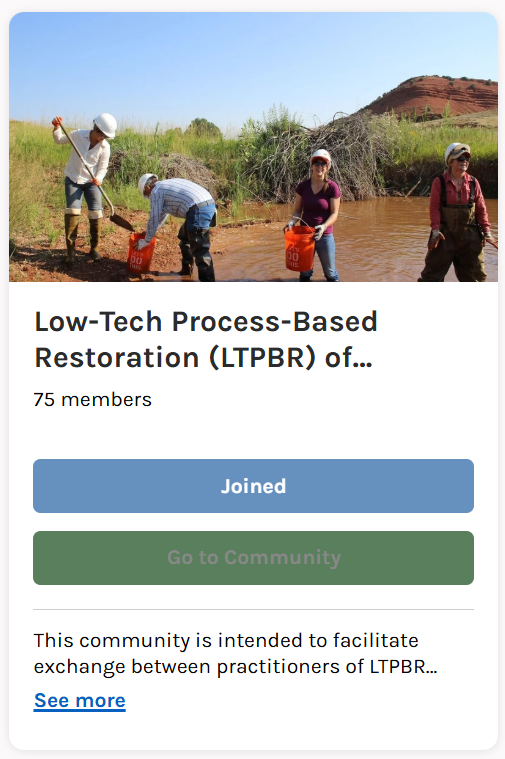
LTPBR of Riverscapes - Practitioner Community
This community is intended to facilitate exchange between practitioners of LTPBR anywhere in the world.
Assignment Resources
This section elaborates on some of the questions you engage with in the Conservation Planning Process (CPP) adapted from Bennett et al. (2019) and outlined in Chapter 3 of the LTPBR Design Manual. There are many ways to answer these questions. Here we focus on some workflows that still emphasize engagement with the questions, using QRiS to document what you are determining or mesuring, and leveraging (if appropriate) outputs from some of our nationally available datasets. You may be surprised for how many riverscapes you can do a decent job of this from the desktop.
If this class was in person, we would use Monday to approximate answers to these questions at the desktop and with freely available data. We would use Tuesday to get out in the field, see how good our desktop assessment was, fill in gaps of our ounderstanding from the desktop, and record new obeservations. Then we would use Wednesday to pull together both field and desktop evidence, and havea revised planning assesssment. You can do this on your own with the riverscapes you work in.
Report Template
You can make your own report, or you can use this Google Docs template for the report. You can expand and refine the section headings as you see fit, but you need to minimally include these sections and answer the questions posed.
If you do use a Google Doc, please share it with your instructor(s), so they can give you suggestions when you submit your project. You may choose to add other students, or make it visible to those with the link.
We show you how to use it in this video:
When you submit your assignment, please do not submit it as a link to the Google Doc. Instead, export it as a PDF and submit the PDF as an attatchment in your Riverscapes Studio Project.
Using Zotero Cite While You Write Add-ON
Optional: Zotero is a powerful and free citation and bibliography manager (alternative to EndNote), which you can use to keep track of your citations. This help reference explains how to use Zotero with Google Docs. You will need Zotero Connector Extension installed in your browser for it tow work with Google Docs.
CPP - Planning Resources
We follow an adaptation of the NRCS's Conservation Planning Process, for Phase 1 (i.e. planning) as illustrated below:
 Figure 3 from Bennett et al. (2019).
- Bennett, S., Wheaton, J., Bouwes, N., Shahverdian, S., Macfarlane, W.W. and Portugal, E. 2019. Chapter 3 - Planning for Low-Tech Process-Based Restoration. In: Low-Tech Process-Based Restoration of Riverscapes: Design Manual - Version 1.0. Wheaton JM, Bennett S, Shahverdian S, and Maestas JD, (Editors). Utah State University Wheaton Ecogeomorphology & Topographic Analysis Lab. Logan, UT. 57 pp. DOI: 10.13140/RG.2.2.15815.75680.
1. Problems & Opportunities
Perform an initial, broad-brush, description of problems and opportunities as suggested in page 5-7 of Chapter 3 of the LTPBR Design Manual.
- Make sure to articulate the broad management goals as best you can. Your job is to restate those management goals as they are dictated by the client, project owner, land owner, policy or otherwise. It is not uncommon for the broad management goal to be somewhat peripherally connected to something that is likely to be improved or achieved by the proposed project. The goal of the conservation planning process is NOT to change the broad management goals. It is to assess whether or not proposed actions can reasonably be expected to achieve those management goals, or to contribute towards them. The broad management goals can act simply as a motivation for the proposed actions.
- In very simple terms, state the basic problems as posed by the client, project owner, land owner, policy or otherwise. This is not a detailed problem statement, but rather a simple statement of the basic problem(s) as you understand them.
- Include a simple articulation of the opportunties that exist within the riverscape to address the problems. This is not a detailed inventory of opportunities, but rather a simple statement of the basic opportunities as you understand them.
- Include a cursory assessment of whether or not the project reach is structurally starved to consider the appropriateness of Low-Tech PBR. Note, that in the resource analysis this is more explicilty considered by comparing existing conditions and expected or historic. This is a screening step to decide early if LTPBR is an appropriate or inappropriate course of action.
Also define your Areas of Interest in terms of property boundaries, land ownership/managment, and/or watersheds.
2. Project Objectives
It is important to restate the broad managment goals in terms of specific project objectives. Revisit the problem (from 1 above) and purpose and confirm or clarify and then recast management goals as SMART (Skidimore 2011) objectives (see page 8-9 of Chapter 3 and in terms of measurable objectives and indicators that tie to riverscape health. This is you articulating what success looks like in terms of measurable outcomes. Be clear as to whether or not the objectives are short-term (1-5 years), medium-term (5-10 years) or long-term (10+ years), and how many phases of work it might take.
-
Clarify if the "project" is a series of project phases that collectively work together, or a single phase of work.
-
Differentiate overall collective objectives towards achieving a sites full recovery space, versus objectives associated with a single phase of work (including a pilot phase) intended to contribute to that overall objective(s). The mapping of recovery space does not necessarily mean it is realistic to achieve that in a single phase of work with process based restoration.
-
Skidmore, P.B., Thorne, C.R., Cluer, B.L., Pess, G.R., Castro, J.M., Beechie, T.J. and Shea, C.C., 2011. Science base and tools for evaluating stream engineering, management, and restoration proposals, U.S. Department of Commerce, Seatle, WA.
Indicator Template Resources
An example template based on Table 3.1 on page 8 of Chapter 3 of the LTPBR Design Manual. is provided below.
| Resource Type | Suggested Resource Link | Notes or Alternative Resource |
|---|---|---|
| Project Indicator Template | Condition Worksheet.xlsx | This is an excel template worksheet for populating active channel, active floodplain, vs. inaccessed floodplain mapping of your valley bottom as a means of cataloging condition and estimating recovery space and constraining design. To the extent possible, you will be using QRiS Analyses to populate these tables (one for every sample frame or reach). |
Overview of Project Indicator Template
This 7 minute video gives an over of the condition worksheet (from Capstone class and different example project).
Warning, most people grasp the idea of choosing the rows for this table (i.e. metrics and indicators) fairly quickly. They then realize that planning is essentially three columns of this table: existing conditions, estimated historic (for reference) and estimated future conditions (i.e. recovery space). Most tend to grasp the concept of recovery space being limited by estimated histroic too. What confuses people most is how many tables they will end up with. You have a separate table for every sample frame or area of interest you choose as the spatial extent of your analysis.
Some think, all I need is one table for my entire property or project area. This may be simple and fine in some cases, but it often makes it difficult to differenatiate important spatial differences in condition and recovery space across the project area. This is why we often have multiple sample frames.
Populating Proportion of Active Valley Bottom Indicator
It is not always appropriate to use proportion of active valley bottom as an indicator, but it is a common indicator for many riverscapes where space has been encroached and recovery space could include reclaiming back some of that space. This video illustrates the concept from a Capstone class and different example project. Even if it is not used as an indicator, it is useful thing to understand and map as part of the planning process to ascertain whehter it is something that is impaired and is realistic to target (i.e. there the currently proportion active perscentage is less than the recovery space percentage - both expressed as proportion of valley bottom area).
For this course, our in class exercise covers proportion active mapping here and recovery space here.
3. Inventory of Resources
See page 9-13 of Chapter 3
Valley Bottom Mapping
Choose your riverscape extent (upstream and downstream) and map your valley bottom (laterally) as a riverscape in QRiS. If you are including multiple reaches on the same riverscape that are seperated, keep these as separate riverscapes. If you are including tributary riverscapes, also keep these as separate riversccapes in QRiS.
We recommend typically classifying and mapping your riverscape into active channel, active floodplain and inactive floodplain components. This begins with reading it and mapping it. We start this by mapping valley geomorphic units and then allowing the delineation of valley bottom to fall out of that mapping of channels, floodplains, terraces, fans and hillslopes.
We can use multiple lines of evidence, including seeing if what VBET estimates for our site is reasonable and confirms our mapping.
Identified Risks within & Adjacent to Riverscape
Map all infrastructure and land use within and adjacent to your riverscape of interest, as well as immediately downstream; use the risk matrix to evaluate).
Recovery Space
Synthesis for each project reach of proportion of valley bottom available as/for recovery space. This should reflect the stakeholder/landowner’s current values.
4. Resource Analysis
Assessment of Current Conditions and Recovery Space
Geomorphic Context
Mapping geomorphic context starts with the valley bottom mapping (F) and basic geomorphic mapping (E), but is really improved when we add the mapping of active confining margins based on the Fryirs et al. (2015) and O'Brien et al. (2019). We can do this in QRiS by digitizing a line layer of active confining margins using our Geomorphic Mapping of Riverscapes Protocol, which we will do as an in-class exercise too (G).
- O'Brien, G.R., Wheaton, J.M., Fryirs, K., Macfarlane, W.W., Brierley, G., Whitehead, K., Gilbert, J. and Volk, C., 2019. Mapping valley bottom confinement at the network scale. Earth Surface Processes and Landforms, 44(9): 1828-1845. DOI: 10.1002/esp.4615
- Fryirs K, Wheaton JM, and Brierley G. 2015. An approach for measuring confinement and assessing the influence of valley setting on river forms and processes. Earth Surface Processes & Landforms. DOI: 10.1002/esp.3893
Details
This video below goes through some generic background on mapping confinement. It is based on a Capstone class and different example project at Brich Creek.
Geomorphic Condition
There are various ways to assess geomorphic condition. Two possibilities in the Weber et al. (2024) LTPBR V. 2 Protocol included in QRiS are:
- Maps (polygons) of active channel plus floodplain area of valley bottom as current vs. potential
- Estimates of geomorphic condition using the Cluer & Throne (2012) Riverscape Evolution Model (see pages 16-18 of Chapter 3).
Note that the Cluer & Throne (2012) conceptual model does not necessarily apply to all riverscapes, but it can be a useful construct for some.
- Cluer, B. and Thorne, C.R., 2013. A stream evolution model integrating habitat and ecosystem benefits. River Research and Applications, 29(8), pp.992-1003.
For an introduction to fluvial geomorphology, see Joe's Fluvial Geomorphology Class. For an explanation of the Cluer & Thorne (2013) Riverscape Evolution Model, see the video in details below or Collin Thorne's lecture here in WATS/CEWA 5620.
Details
This video below goes through some generic background on assessing geomorphic condition, primarily by using the Cluer & Thorne (2013) riverscape evolution model.
It is based on a Capstone class and different example project at Brich Creek. Applying this to Birch Creek requires a visit in the field and broader training than we have provided you in fluvial geomorphology then this class. As such, I explain to students of that class in the video below how I obtained them.
Identification of pathways of recovery (optoinal)
If the riverscape evolution model is relevant to your site, it can be helpful to identify current stage(s) and target stage(s) and articulate what trajectory and geomorphic processes will be necessary to get to recovery space).
See page 16 of Chapter 3 for more details.
Flow Regime’s ability to "Do the Work" of Restoration
It is crucial to assess the flow regime of your riverscape for process-based restoration to see if the hydrologic engine is present to do the work necessary to follow the desired recovery trajectory. This is not a hydrologic analysis course, but we do need to at least assess whether or not the flow regime is likely to be sufficient to mobilize sediment and wood, inundate floodplains and reconnect them to the active channel, and move water through the riverscape in a way that supports riparian vegetation and beaver activity.
See pages 14-15 of Chapter 3 for more details. For the US:
Details
| Resource Type | Suggested Resource Link | Notes or Alternative Resource |
|---|---|---|
| Flow Regime Assessment | StreamStats | Typical peak-flow statistics (e.g. Q2 and Q100) are easy to estimate using StreamSTats. You can download flow gague data and do your own regional curves, but this is a reasonable approximation in under 10 minutes. |
| Stream Power & Flow Assessment | Hydrologic Context Estimates | For a given segment of reach, anywhere in the lower 48, we provide a baseflow and Q2 streamflow estimate and stream power estimates. |
| Stream Gage Explorer in QRiS | Help Documentation | All this too does is is retrieve from NWIS (below) all the nearby stream gages and their records within your QRiS project. |
| National Water Information System (NWIS) | USGS Water Data for Nation | USGS's national repository of stream gage data and other water data. |
Although we have a Catchment tool in QRiS that uses StreamStats, the USGS API we call is currently unable to return the actual stream flow statistics. It is useful for returning a delineated watershed and basin statistics. So you can use StreamStats directly from the USGS site to get flow statistics for your site.
In this video, I review how you can use StreamStats to address the flow regime's ability to "do the work" by simply getting you some discharge estimates.
It is based on a Capstone class and different example project at Brich Creek.
Riparian Condition to support Process of Wood Accumulation
Think about what you can do map existing and potential woody resources (riparian and upland) for processes of wood recruitment, wood transport and wood accumulation. From page 19 of Chapter 3 of the LTPBR Manual, we look at riparian conditions to address the key question of “is it likely that a self-sustaining source of woody structure can be restored?”
We can ask:
- What is existing riparian vegetation in the valley bottom relative to historic conditions? with RCAT
- Can the riverscape and adjacent uplands support provide a source of woody debris and is natural wood recruitment possible?
- How accessible is the floodplain for flooding and riparian vegetation recruitment (infrastructure / like levees; this is the active channel plus active floodplain you did above?
- What land uses are taking place in the valley bottom and are they compatible with maintaining a self-sustaining source of structure?
- How many woody debris jams are currently present? How many could be given the current wood supply? How many could be given the potential wood supply?
As with geomorphic condition, these questions can often be answered simply by walking a site and assessing wood resources and recruitment potential. You can count jams off the imagery and report them as quantities or linear densities (i.e. jams per mile) for more consistent intercomparison across sites (e.g. as illustrated in Weber et al. (2024) LTPBR V. 2 Protocol included in QRiS).
Details
The Ripairan Condition Assessment Tool gets at some of these lines of evidence for some riverscapes. For others you will need to make an interpretation and your own assessment of riparian resources.
| Resource Type | Suggested Resource Link | Notes or Alternative Resource |
|---|---|---|
| Riparian Condition Assessment Tool | Get RCAT data from Data Exchange | RCAT projects can be looked at to get a rough idea of riparian condition and wood recruitment potential. These are based on 30 m LANDSAT derivatives from LANDFIRE, and are descent. Sometimes combining this with aerial imagery and a site visit is adequate. Don't be afraid to overide what these models when run with coarse input data suggest, with what you observe on the ground. |
| National Wetland Inventory | NWI is now part of Riverscapes Context | NWI data can be useful to help identify existing wetlands and riparian areas. It is not perfect, but it is a good start. |
Below we show what can be gleaned from RCAT as a line of evidence. It is based on a Capstone class and different example project at Brich Creek.
Riparian Condition Capacity to support Process of Beaver Dam Activity
Allowing beaver dispersing from upstream to move down in and maintain water in this reach could be adventagoues. Where beaver dam activity is an immediate, or long-term goal, the question to ask is whether or not beaver dam actiivty could be sustained and if so to what level? From basic observations (sometimes good enough from imagery at desktop - or improved with field visit)
- Nubmer of Dams in a reach that can be supported currently (e.g. count of capacity)
- Comparison to what might have been supported their historically (i.e. count of upper plausible extent of capacity)
With that information you can compare what sort of recovery space is possible in terms of a capacity bump. Note that the recovery space may be less than historic capacity if the area within 100 m of the channel is not likely to increase is favorable production of vegetation to support dam building activity. Finally, you can:
- Count existing beaver dams
- Compare existing dams to current and potential capacity (uplift potential)
- Consider if there are any areas where beaver could cause unintended harm that may need to be mitigated and/or identified in adaptive management plan.
Details
| Resource Type | Suggested Resource Link | Notes or Alternative Resource |
|---|---|---|
| Beaver Restoration Assessment Tool | Get BRAT for your site from Data Exchange | See what BRAT estimates beaver dam capacity, risk of undesireable dams, and restoration and conservation opportunties with beaver dam building activity for your riverscape. |
| Perform your own BRAT assessment with QRiS or by hand | Experimental BRAT CIS Protocol (documentation forthcoming) | Simply fill out the form and it uses the CIS to calculate an estimated capacity. You can also make this assessment by asking the questions that BRAT does in the field or at the desktop with the BRAT cIS paper form. |
This video shows how to download and use the primary outputs of BRAT. It is based on a Capstone class and different example project at Brich Creek.
Project Objectives
Revisit problem and purpose and confirm or clarify and then recast management goals as SMART objectives (see page 8-9 of Chapter 3) and in terms of measurable objectives and indicators that tie to riverscape health.
In Class Exercises
Data for Exercises
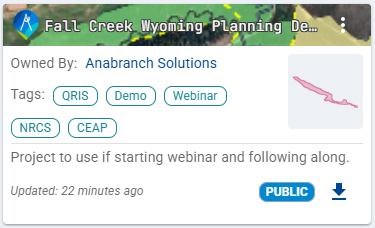
Fall Creek Demo - Riverscapes Studio Projects
Riverscapes Studio Collection with Starter & Full Project for Fall Creek, Wyoming with context layers.
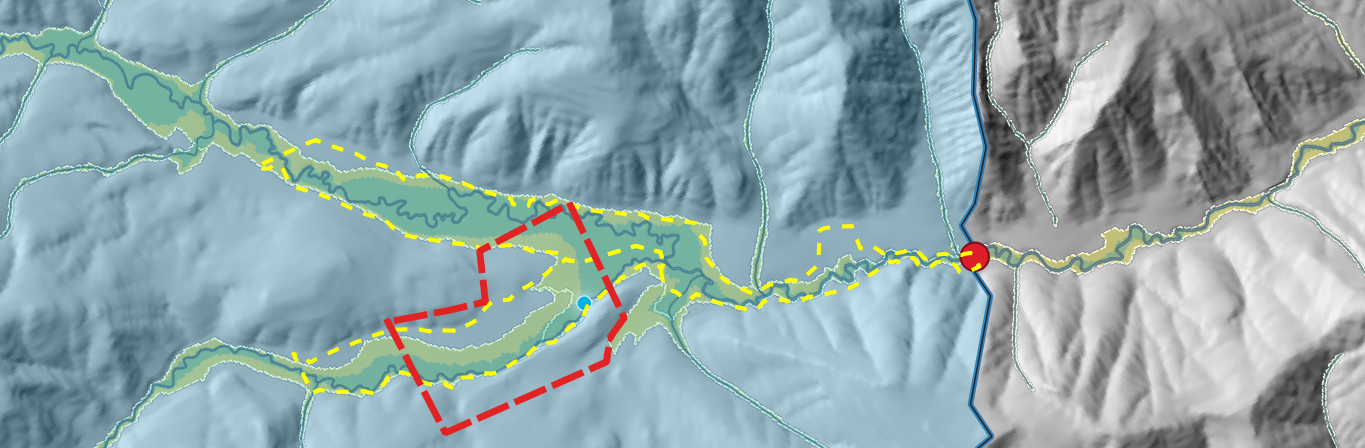
Fall Creek - Riverscape Models for Context
Collection of Riversapes Context and Valley Bottom and Antro Projects from Data Exchange
In class, we will work through exercises to practice the steps of LTPBR Planning using QRiS. We will use freely available datasets from the Riverscapes Data Exchange to create a QRiS project for a hypothetical assessment of Fall Creek, Wyoming.
In general, you will be expected to apply what we cover in exercises to your own project for the assignment.
A. Install and Open Project
QRiS and Riverscapes Viewer are plugins to QGIS. You will download and install them directly in QGIS.
- In the QGIS menubar at the top of the page, Plugins > Manage and Install Plugins.
- Install the Riverscapes Viewer plugin first. Search for Riverscapes Viewer and click the Install button. This is a required dependency for QRiS.
- Install the QRiS plugin next. Follow the same steps to Plugins > Manage and Install Plugins and search for QRiS. Click the Install button.
- Create a new project, or open the one provided after downloading
B. Download Riverscapes Projects and Explore Context layers
- Under the QRiS Plugin pane, right click on your project name, and select Browse Data Exchange Projects. This will open a Data Exchange window in your web browser, zoomed to the map area open in QGIS.
- In the Data Exchange, you can zoom out as needed to be sure you select the HUC 10 you’re working within. Click your HUC 10 and find a Valley Bottom (VBET) project. Click the project. A banner at the top of the project page will alert you if there is a newer version of the Valley Bottom project run. Download your Valley Bottom project.
- Follow the same steps to find and download the Riverscapes Context and Anthro Projects as well.
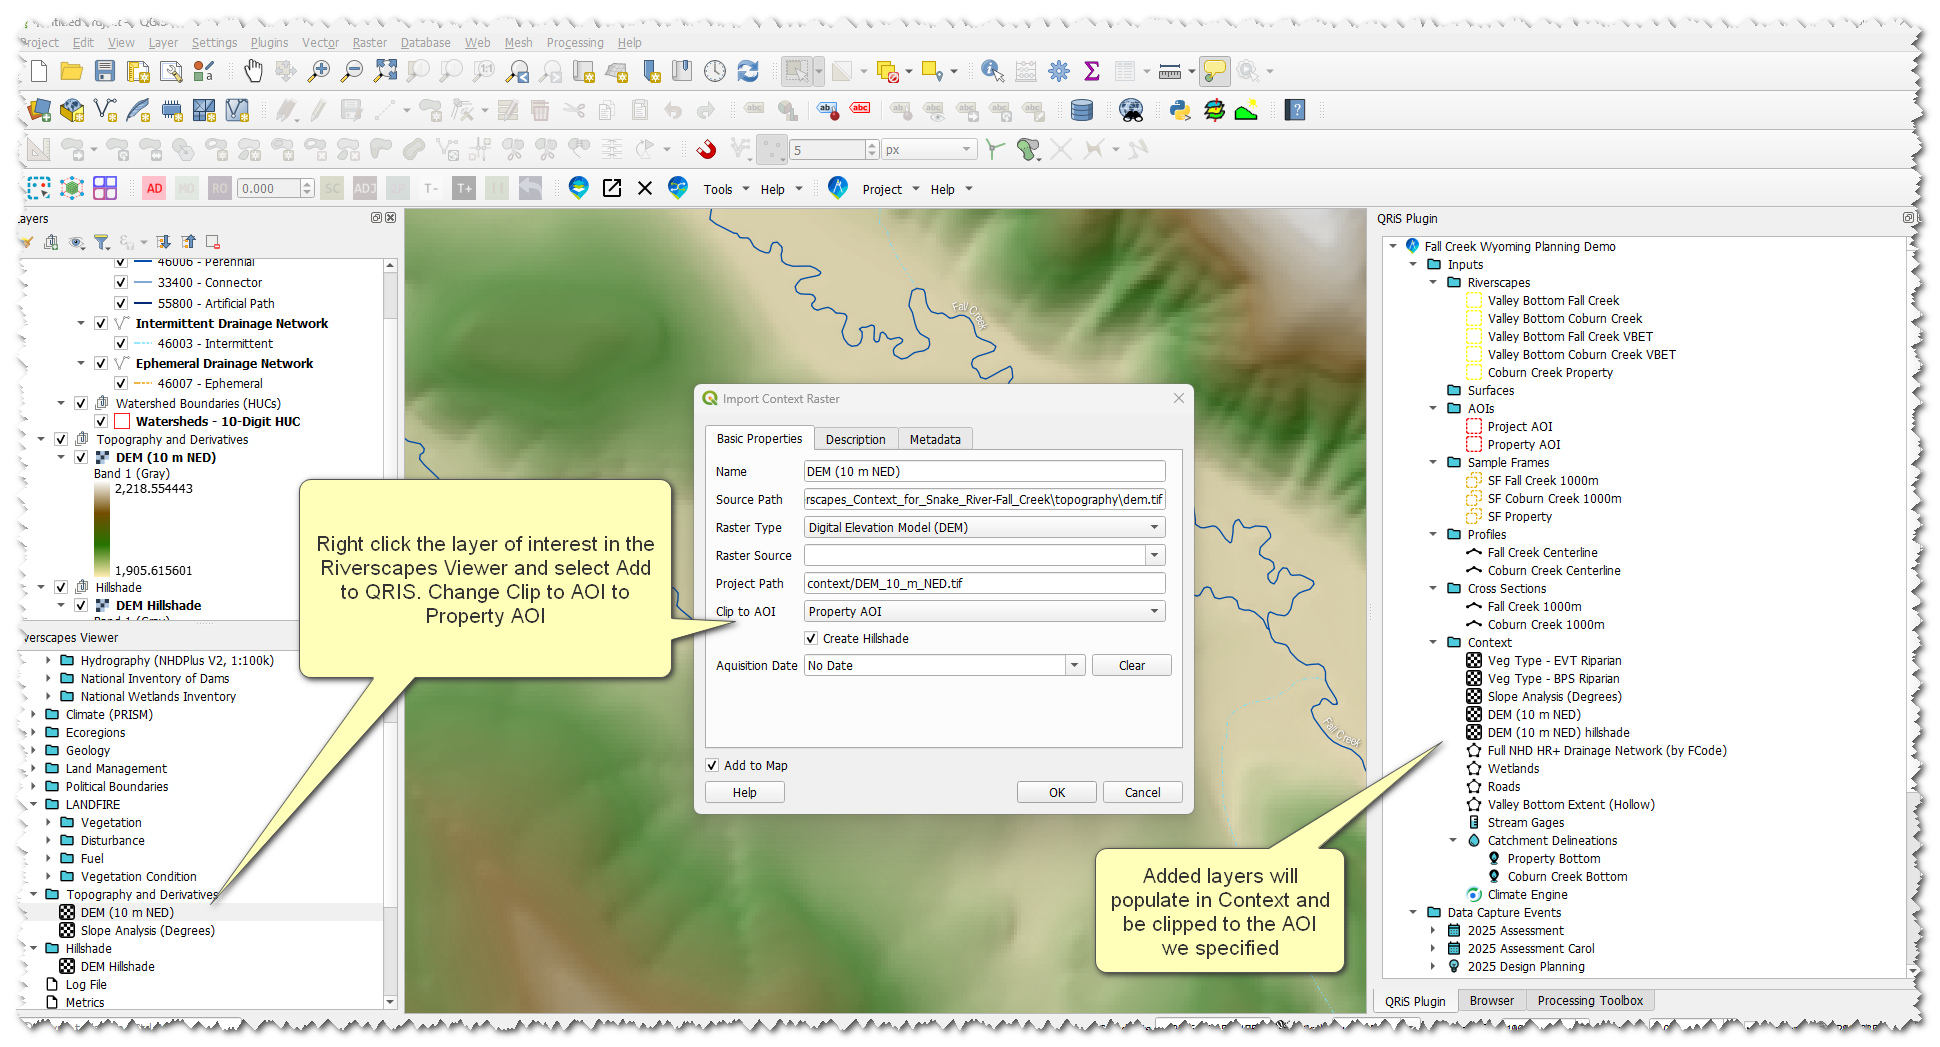
C. Populate Project with Context layers
- Open your Riverscapes Context Project throught the Riverscapes Viewer Plugin by browsing to and selecting the project.rs.xml
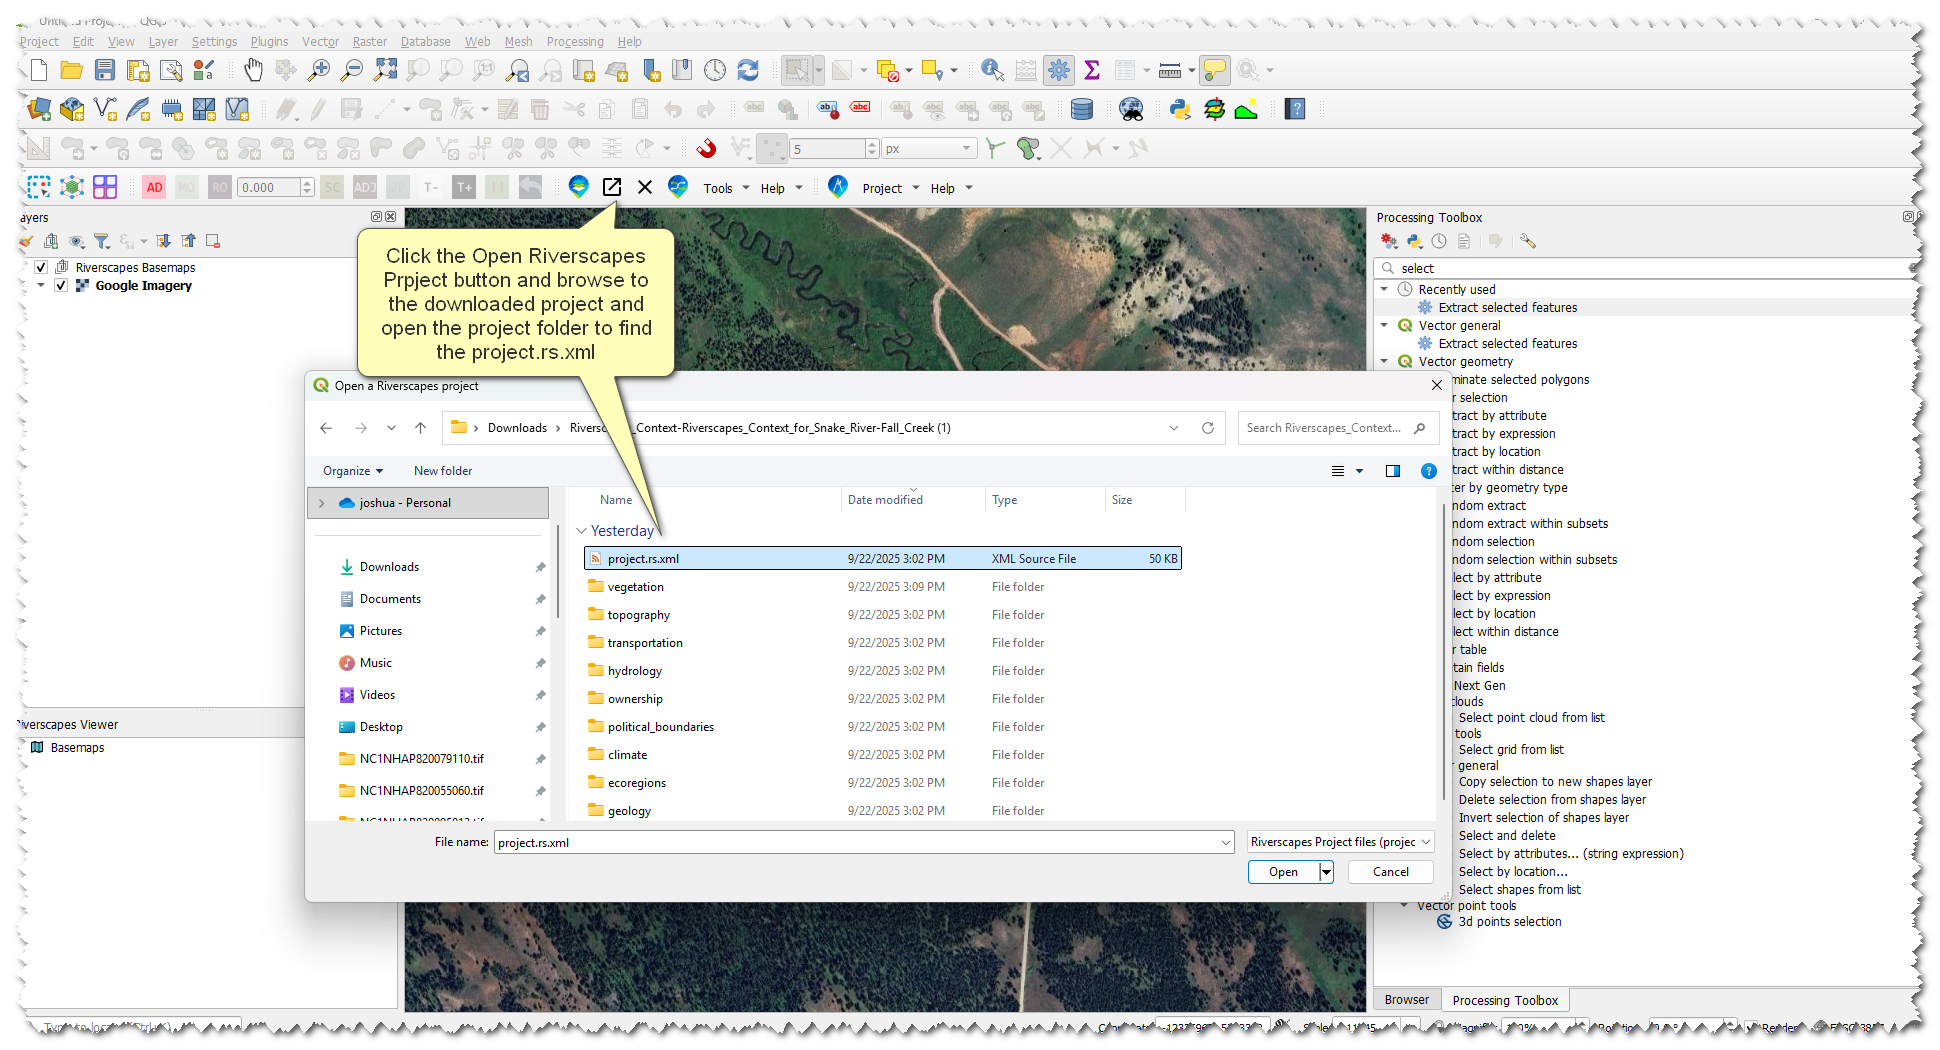
- Browse the layers and double click on them to add them to the map, look for layers that help add context to our riverscape
- Once you have located contextual layers in the riverscapes project we are going to import them into our QRIS project
- Right-click the DEM layer under Topography and Derivatives -> Add to QRIS
- Change the 'Clip to AOI' dropdown to our Project AOI -> click OK
- Repeat this process for Slope Analysis, Wetlands, Existing Riparian and Historic Riparian.
D. Create a Data Capture Event
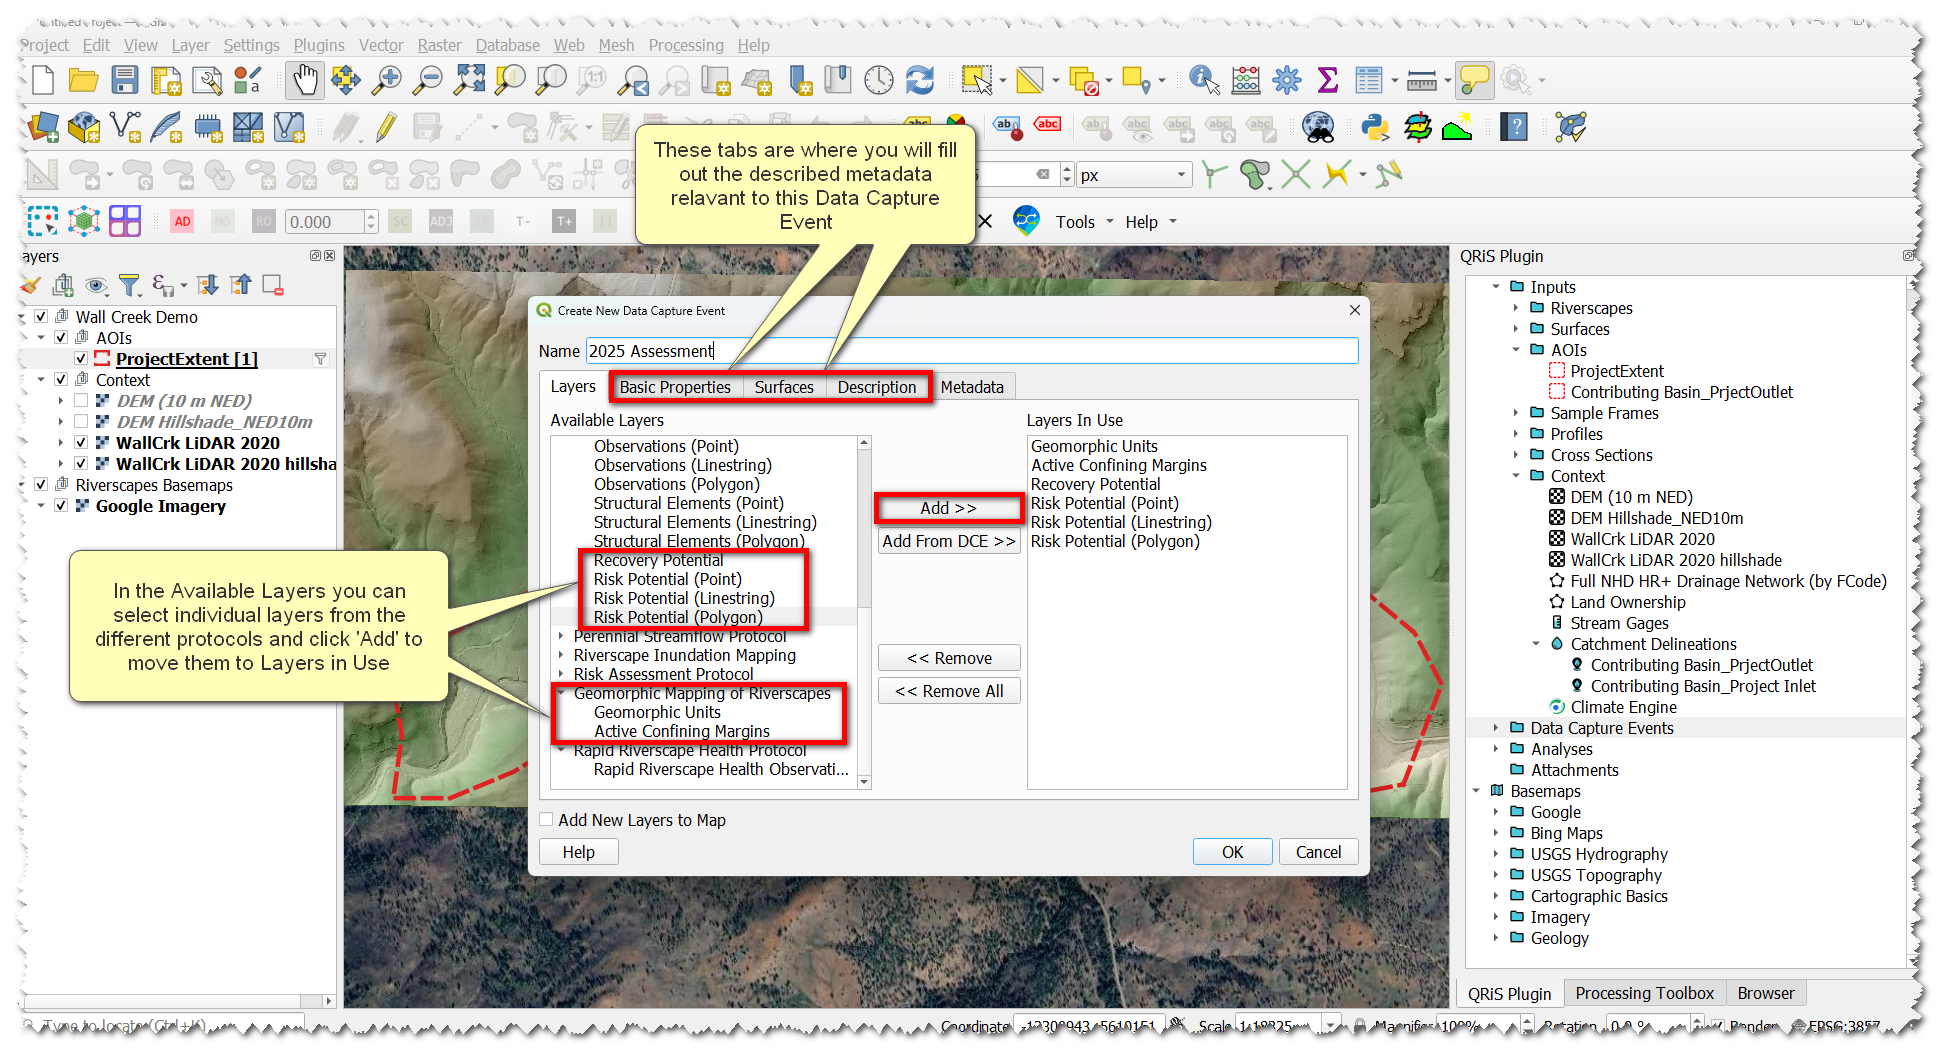
- Right-click Data Capture Events node -> Add New Data Capture Event
- Select Geomorphic Mapping of Riverscapes in the pop-up window. Click Add.
- Under LTPBR Protocol, add layers:
- Risk Potential (points, lines, polygons)
- Recovery Space
- Name the DCE something useful, like 2025 Assessment
- In the Basic Properties tab, set the data of the DCE based on the date or date range of datasets used as your evidence layers (this may be difficult to do in our example since we are using basemaps)
- Under Surfaces, select your datasets that you plan to use as context for digitizing features
- In the Description tab, write a brief description of this DCE. A good description in this example would be, “This DCE represents the planning portion of this project. It is based on freely available datasets from the Riverscapes Data Exchange”
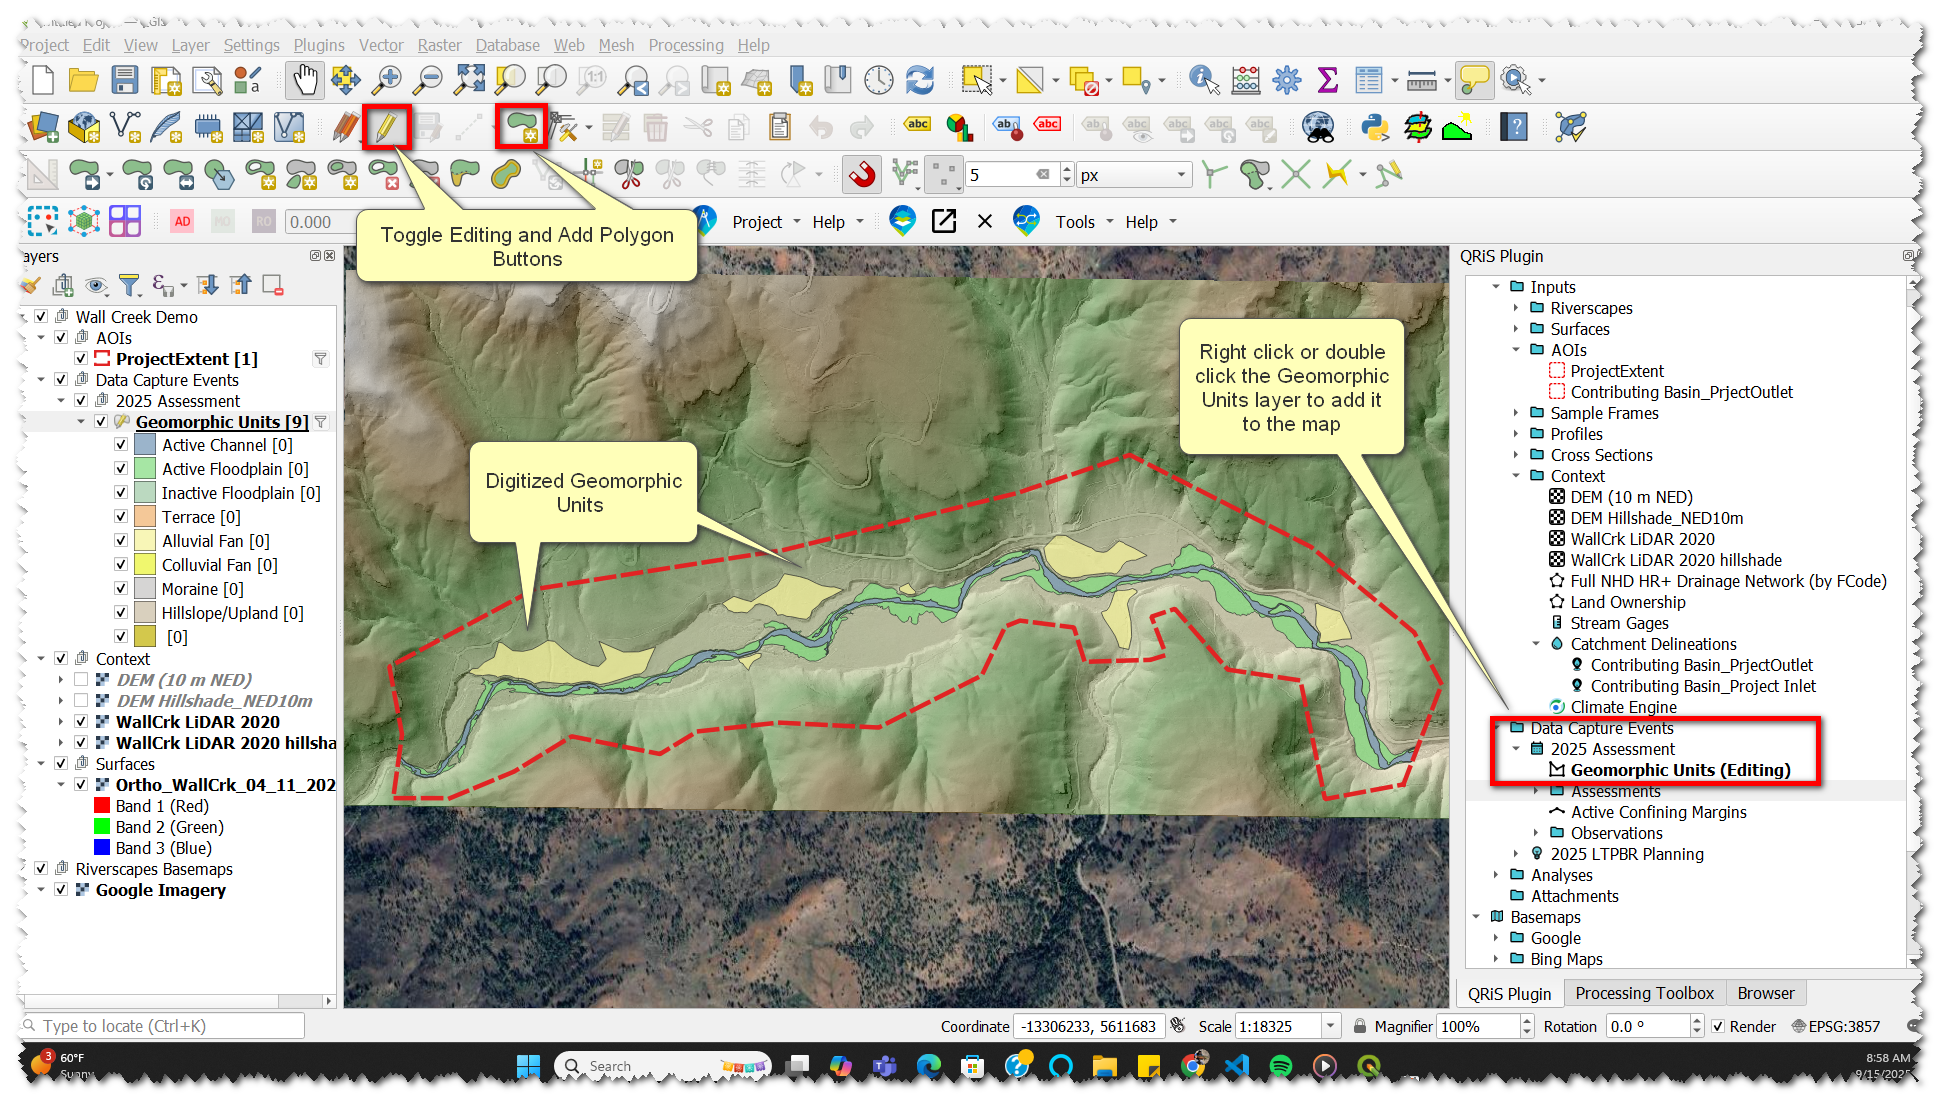
E. Map Geomorphic Units
- Add the Geomorphic Units layer to the map (either by double-clicking, or right-click -> add to map)
- With the Geomorphic Units layer selected, toggle editing.
- Click Add Polygon Feature. Using this tool, digitize terraces and fans, then digitize your active channel.
- Note: This is a great place to start using the Profile tool. The Profile Tool provides a better understanding of a landscape than visual identification, resulting in better mapping accuracy.
- Pull cross-sections from hillslope -> valley bottom -> hillslope to help verify valley bottom boundaries. Try it again across sections of the riverscape you suspect are hillslope transitioning to valley bottom to fan. This can help you draw your unit boundaries more accurately.
- Note: This is a great place to start using the Profile tool. The Profile Tool provides a better understanding of a landscape than visual identification, resulting in better mapping accuracy.
- Save edits by clicking the toggle editing button and save on the pop-up window
F. Map Valley Bottom and Compare to VBET
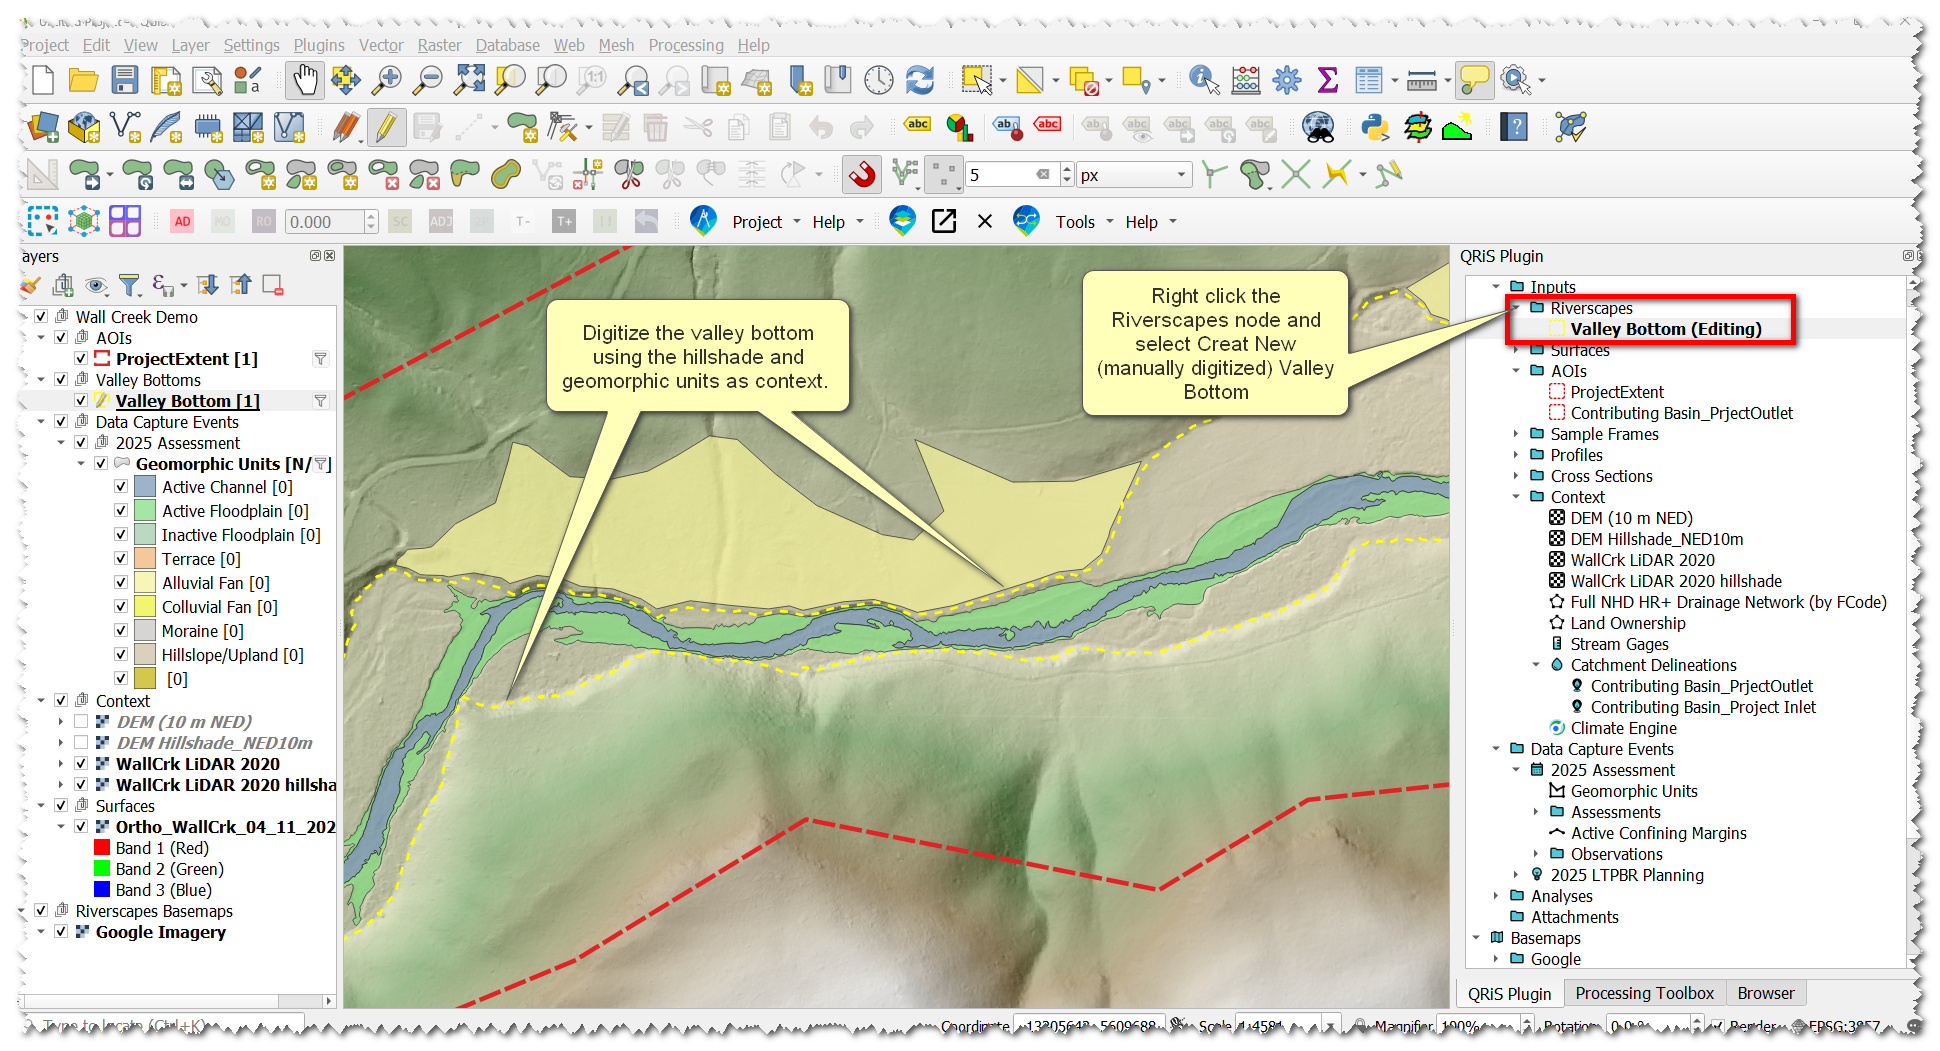
Manually Map the Valley Bottom
- Right-click Riverscapes node -> Create New (Manually Digitized) Valley Bottom. Name and describe the layer in the pop-up window.
- With the new valley bottom layer selected -> toggle editing.
- Click Add Polygon Feature.
- Digitize valley bottom polygons, informed by the hillshade and valley geomorphic units we just digitized. The valley bottom only (this layer) includes active channel and floodplain, and excludes fans and terraces.
- Save edits by clicking the toggle editing button and save on the pop-up window.
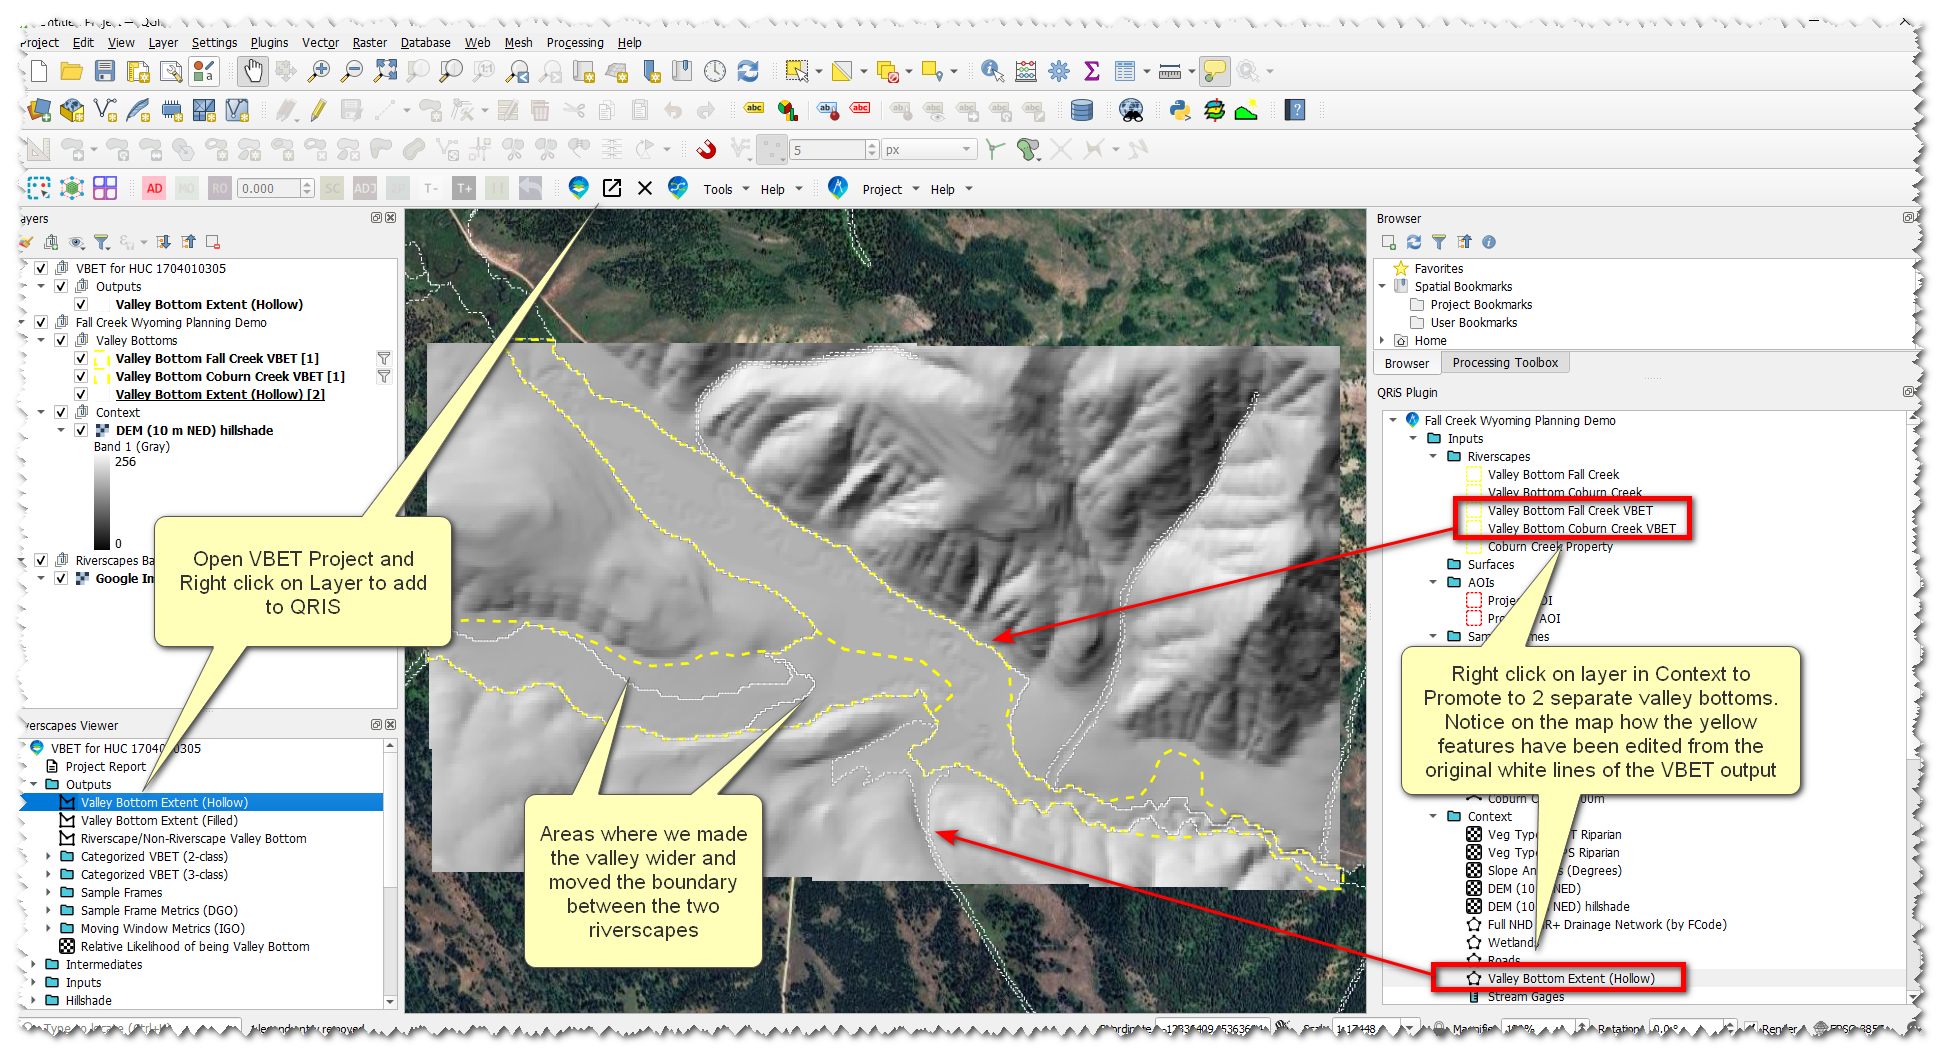
Open a VBET Project to Compare and Import into Project
- Open the VBET Riverscapes project that we downloaded earlier through the Riverscapes Viewer by browsing to and selecting the project.rs.xml
- Expand the Outputs folder -> Right click on "Valley Bottom Extent (Hollow)" and select 'Add to QRIS'
- In the pop-up window select the "Project AOI" from the 'Clip to AOI' dropdown menu, click ok to import the layer
- That layer will now appear in your project under the context node, we will now promote it to a Riverscape
- Right-click on the "Valley Bottom Extent (Hollow)" layer in Context -> Hover over 'Promote to...' and select "Riverscape Valley Bottom"
- Rename the valley bottom to Something like "Fall Creek Valley Bottom VBET" to indicate that this valley bottom is from VBET and its for the riverscape of Fall Creek
- Repeat steps i. and ii. but this time change the name to "Coburn Creek Valley Bottom VBET"
- Individually edit each of the 2 new riverscapes to achieve a few different things
- Make sure there is one feature for each of the two riverscapes, you will need to delete extra features that dont correspond to the riverscape
- Edit the valley bottom extent to include or exclude places you think the VBET output is wrong (if necessary)
- Edit the valley bottoms to join in the correct location (sometimes vbet over exaggerates the mainstem valley bottom up the tributaries)
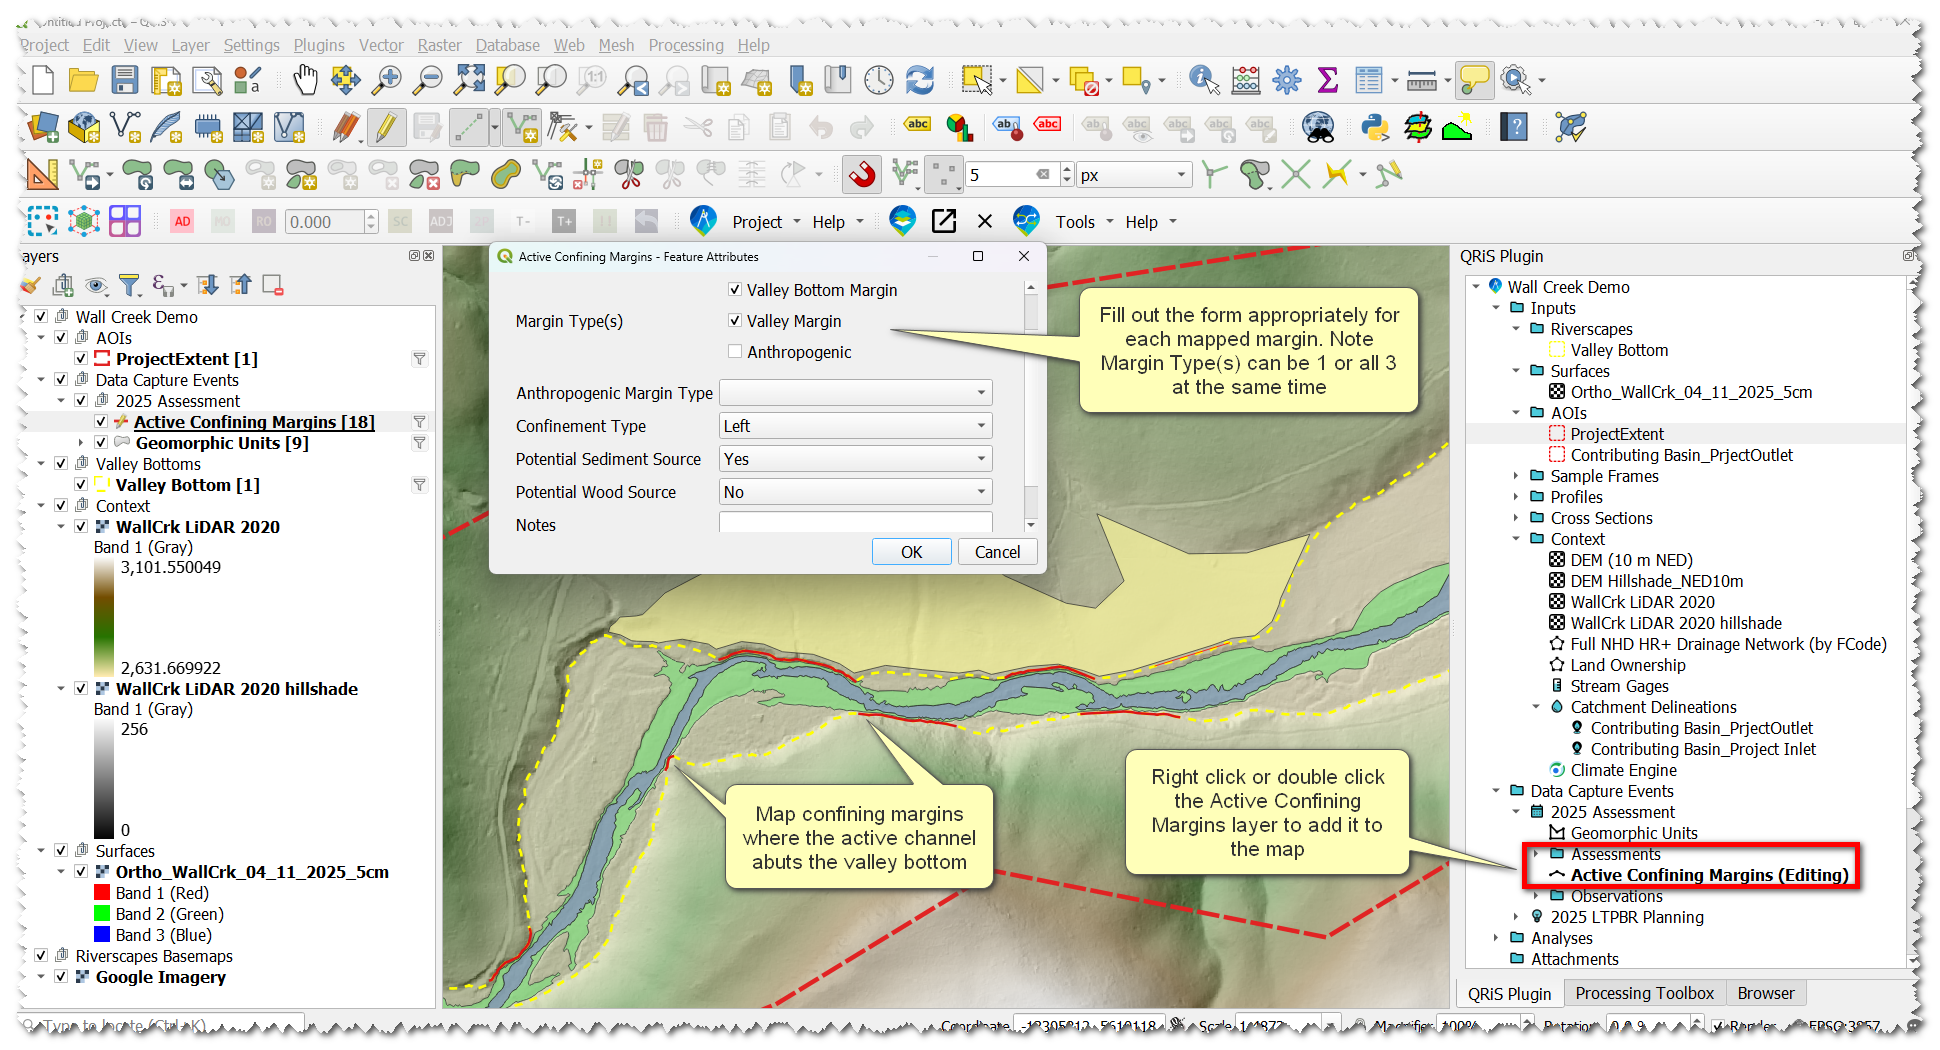
G. Map Active Confining Margins
- In your DCE -> Active Confining Margins layer -> double-click or right-click -> add to map
- With the Active Confining Margins layer selected, toggle editing.
- Digitize places where the channel abuts a confining margin. Select the appropriate attributes associated with each mapped margin
- Save edits by clicking the toggle editing button and save on the pop-up window.
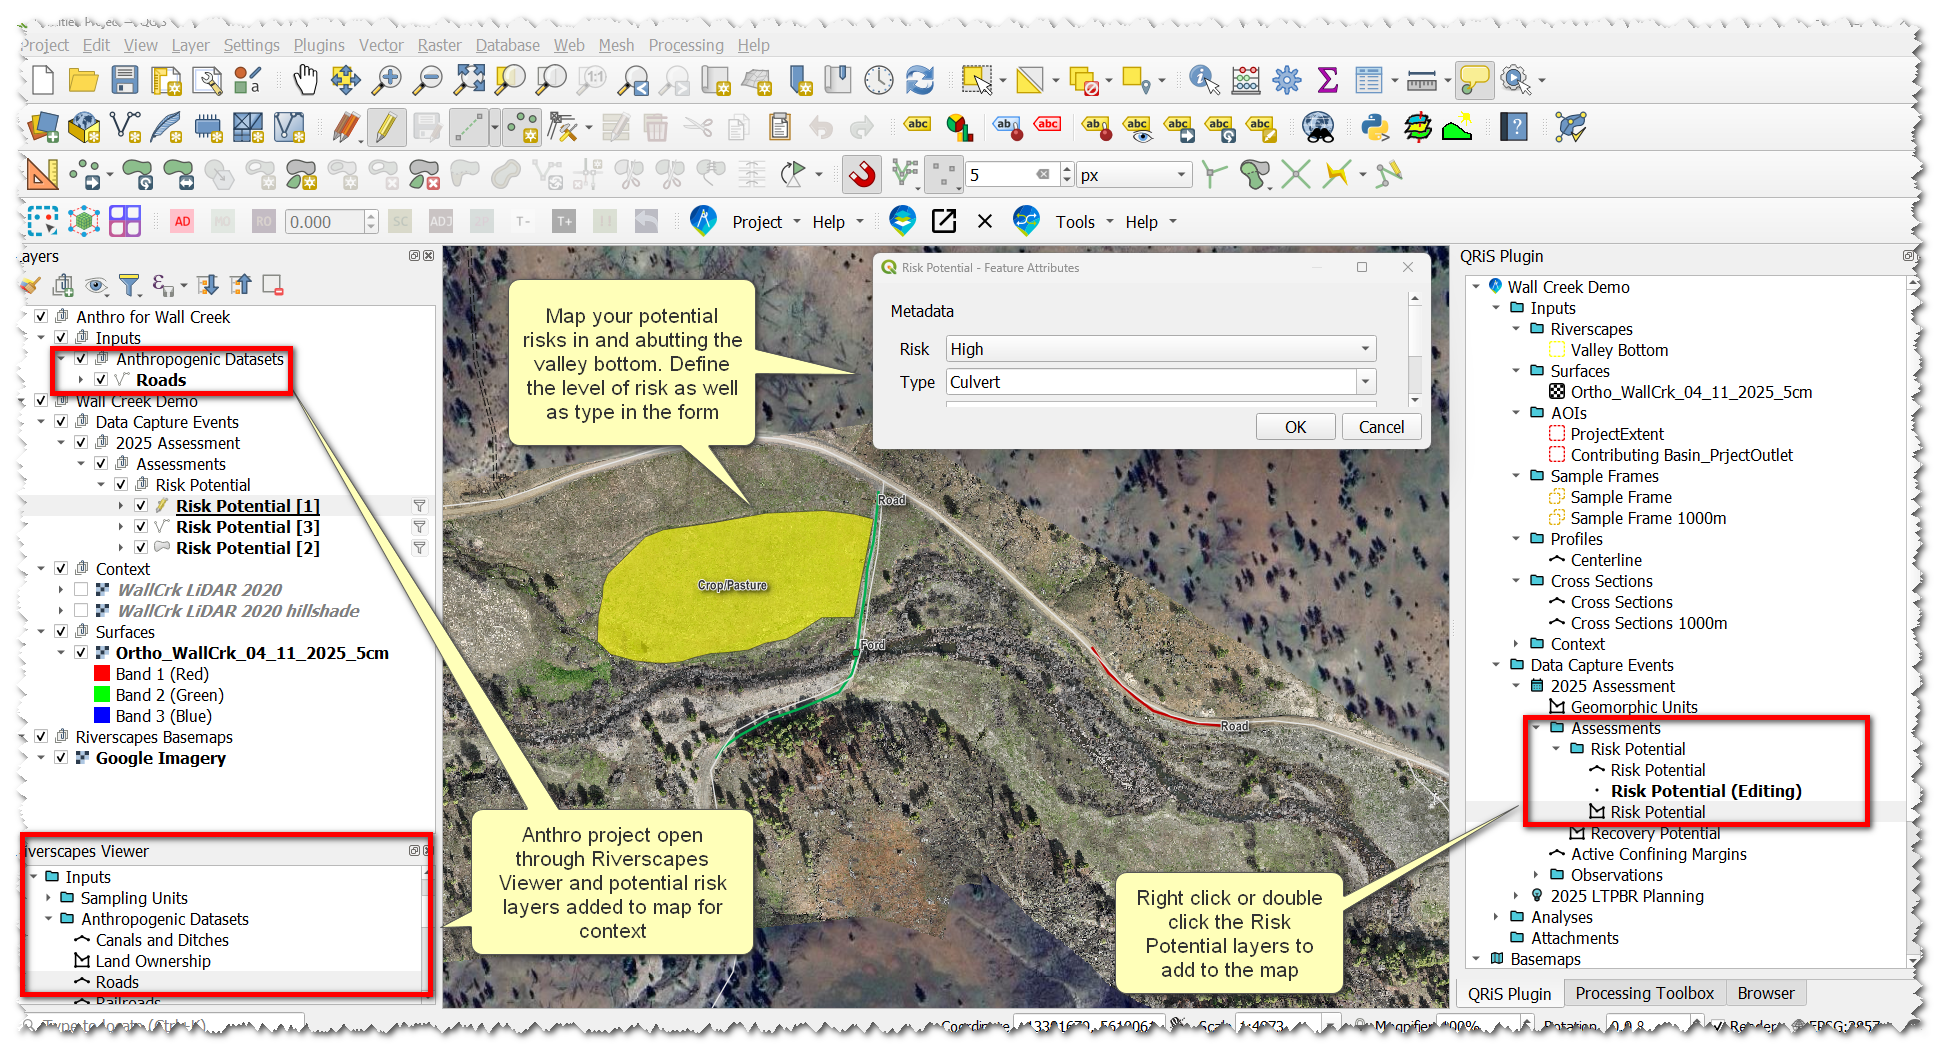
H. Map Risk
- Open the Anthro Riverscapes project that we downloaded earlier through the Riverscapes Viewer by browsing to and selecting the project.rs.xml
- In the Riverscapes Viewer panel, add potential risk layers to the map (layers such as roads, canals, land ownership, etc). We’ll use these as the basis for delineating your risk layers next.
- Add one of your QRIS risk layers to the map and toggle editing. There are three different Risk Potential layers: points, lines, and polygons. Digitize these as:
- Polygons: risk you may need to create a boundary on, like a building or pasture
- Lines: roads, canals, etc
- Points: culverts, bridges, etc
- Assign risk attributes for features including type and severity
- Repeat on each layer individually as necessary.
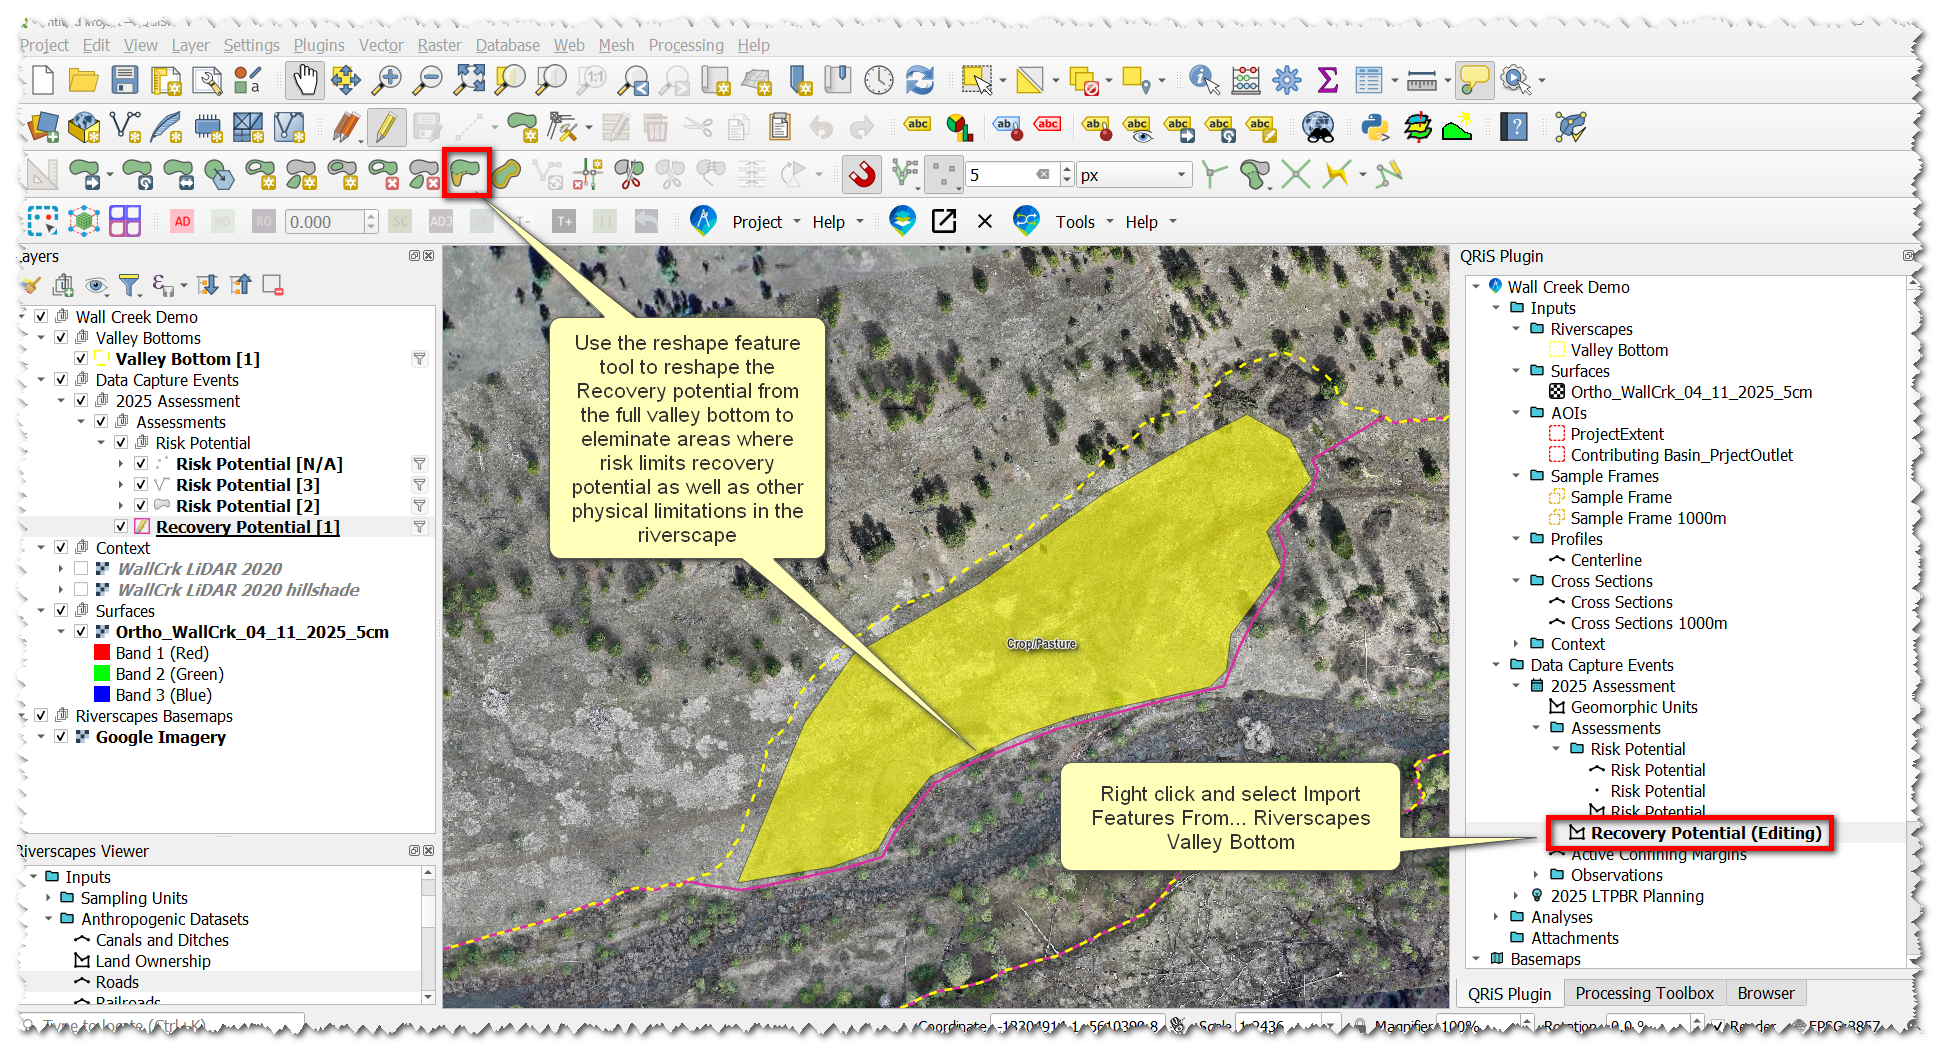
I. Map Recovery Space
The riverscape valley bottom is the baseline for recovery space, so we’ll start with that previously-digitized information. This step will duplicate the Valley Bottom geometry into the recovery space layer where we can make necessary edits without having to start from scratch.
- Right-click on the recovery space layer -> Import Features from Riverscapes Valley Bottom
- Toggle editing on the layer. Use the Reshape Features digitizing tool to make edits where necessary.
- You will have to do this twice for your two different VBET riverscapes we created earlier.
Here, we can look at the risk layers we digitized and determine what we can actually recover in the riverscape. Consider what portions of the active floodplain are recoverable, versus parts separated by a berm, levee, or other limiting factor not involved in risk mapping.
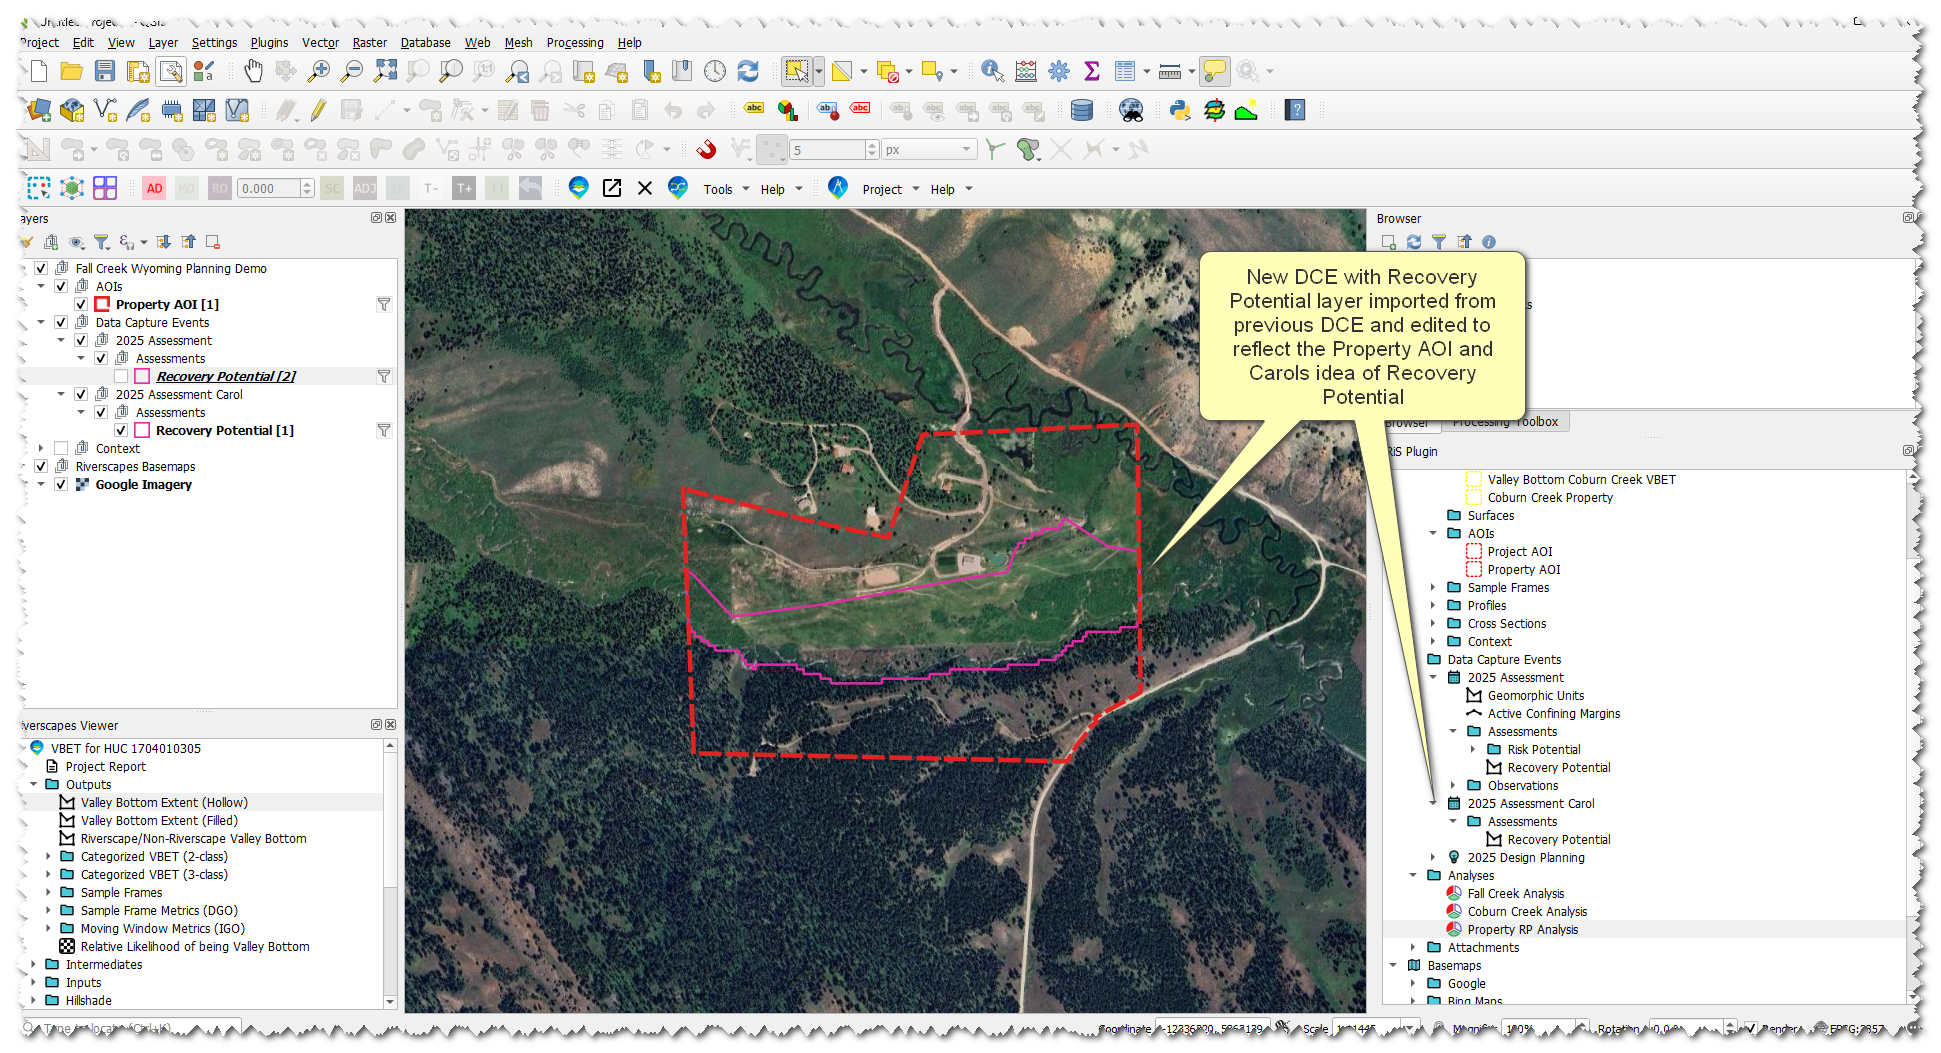
J. Carol vs Pops, Differing Ideas on Recovery Space
In Our Module 4 example Carol and Pops have differing ideas on what recovery space should look like. If we compare what we digitized it matches pops, so we need a way to create another recovery space for Carol to compare against.
- Create a New DCE and call it "2025 Assessment Carol"
- Follow the same steps we did earlier for creating a DCE but only select the recovery space layer from the LTPBR Procotol
- Rather than digitizing a new layer we can import from a previous DCE. Right-click the recovery space layer in the new DCE and select "+ Copy from Data Capture Event" -> Select the appropriate DCE.
- Add that layer to the map and toggle editing
- Delete the feature that corresponds to the Fall Creek Riverscape and edit the remaining feature to the extents that Carol drew as well as to the Property AOI
- Saved edits
We now have 2 DCEs with different recovery space layers that we can compare in Analyses. However, we need a corresponding Sample Frame for that Analysis. This will be addressed when we generate sampe frames.
K. Assess the Riverscape Potential to Support Wood Accumulation and Beaver Activity
- Right-click on your main DCE and add the BRAT CIS Reaches layer from the BRAT CIS Protocol. Add the Structural Elements Points and Inundation Extents layers from the LTPBR Protocol. Click Ok to add them to your DCE.
- Use the Structural Elements layer to digitize dams and jams.
- Use the BRAT CIS layer to assess beaver activity capacity at a reach scale.
- Map the Inundation Extents layer.
- Using these layers as well as model outputs from BRAT and RCAT assess whether or not there is structural starvation in your riverscape and whether or not the riverscape has the ability to support beaver activity.
L. Create a Planning Container
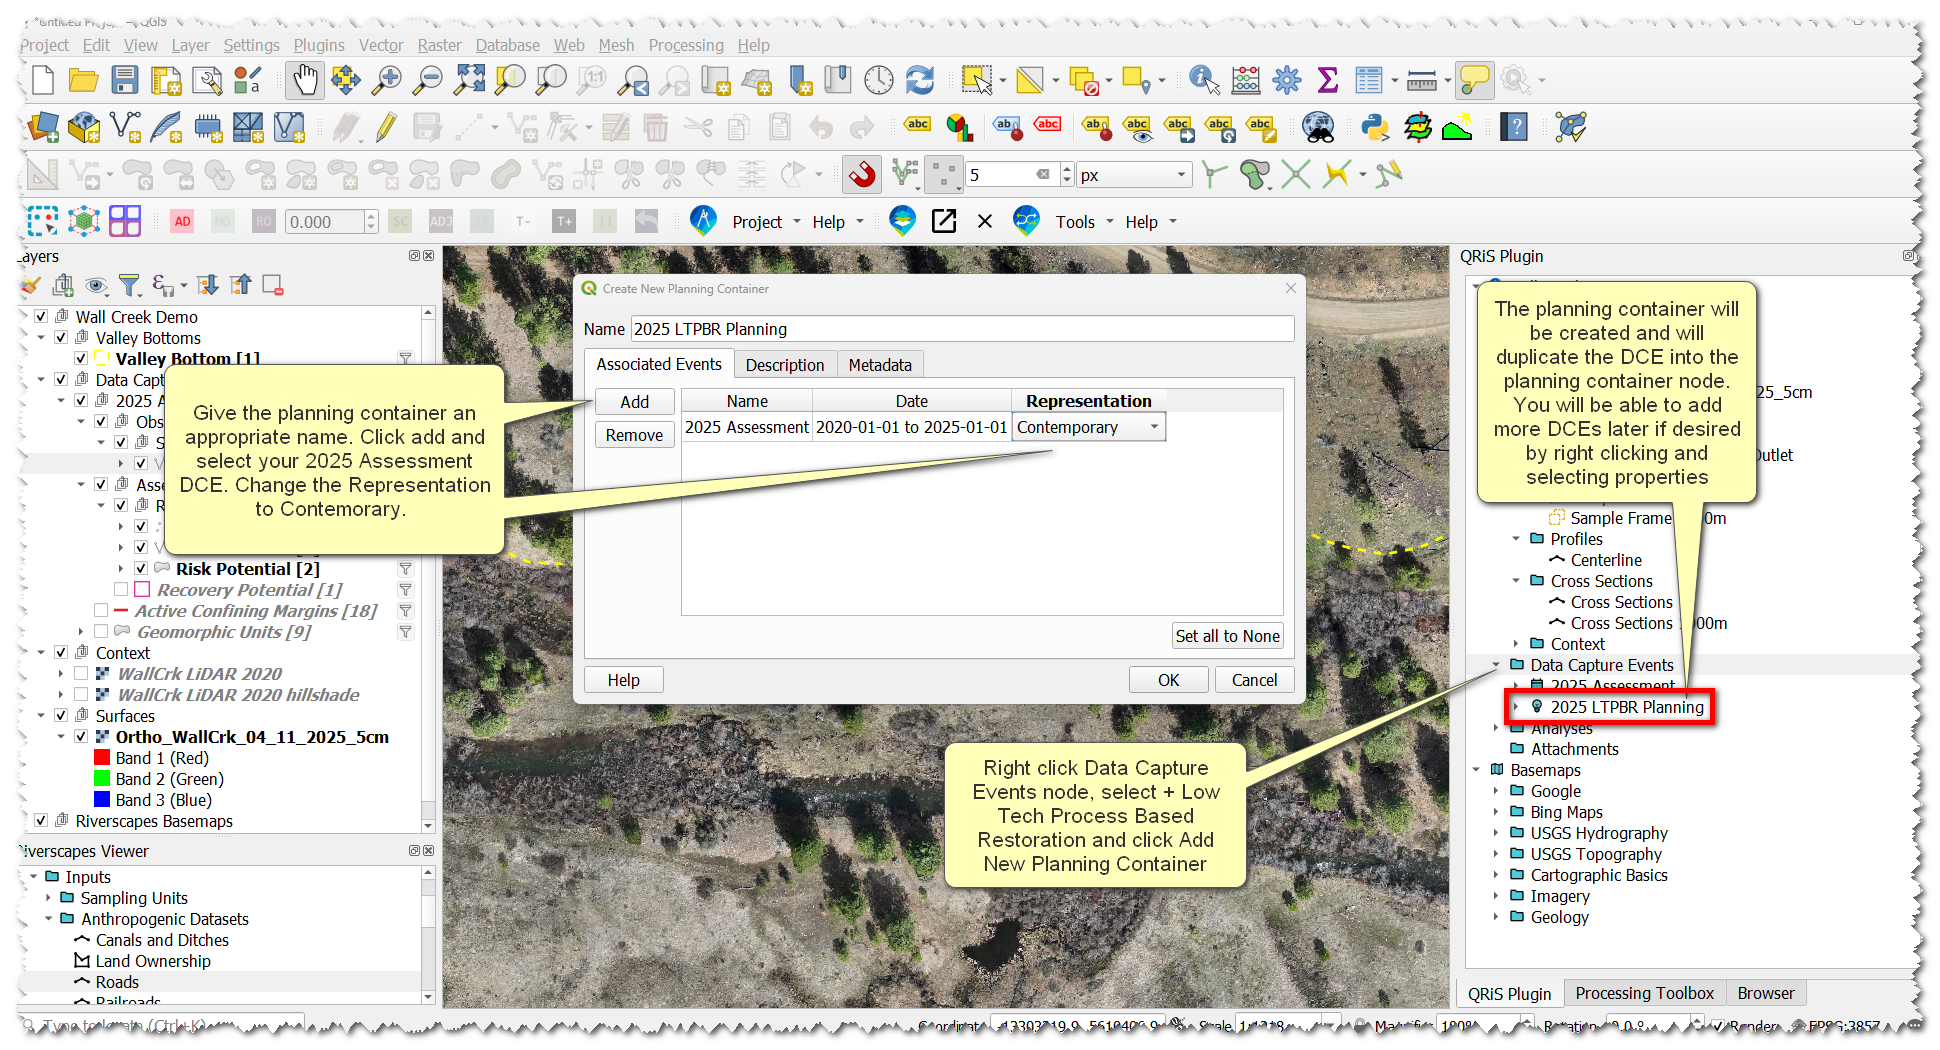
- Right-click Data Capture Events Folder -> +Low Tech Process Based Restoration -> Add New Planning Container
- In the pop-up, name it something useful, like 2025 LTPBR Planning. Click add -> select 2025 Assessment DCE. It will now populate the table. Change its representation to Contemporary.
Ideally, a planning container would also have both a Historic and Predicted DCE. A planning container simply copies DCEs into a new parent folder, which you’ll reference as the basis for LTPBR Design, when we get there.
M. Generating Sample Frames
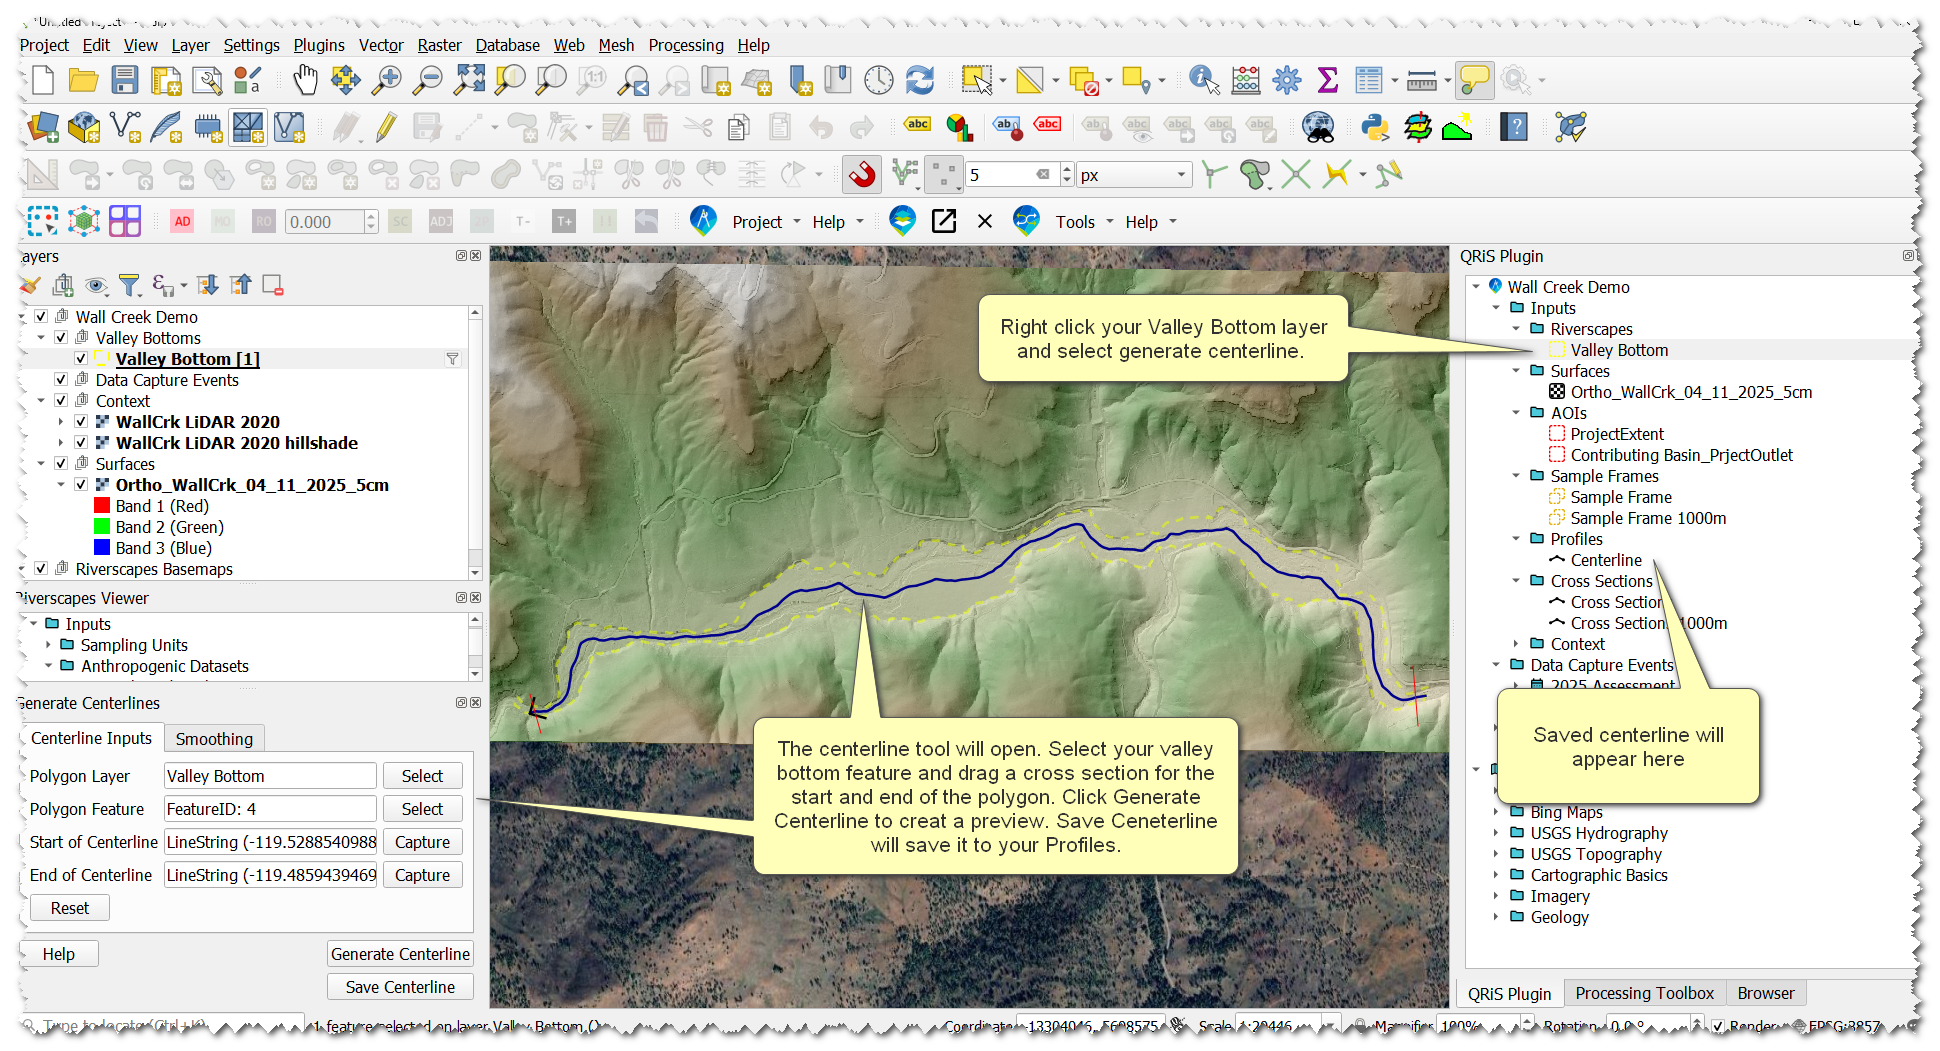
Sample Frames are what QRIS uses to calcualte metrics(i.e. zonal statistics) within as part of analyses. Sample Frames can be any polygon, but here we’ll consider two specific ways QRIS supports to create sample frames of riverscapes: i) using derived cross sections and ii) manually digitized cross sections (or reach breaks). If you want standardized reach lengths use derived cross sections. If you want to be in control of reach breaks then manually digitize cross sections. You may want to do this if there is a change in land ownership or a change in riverscape characteristics.
- Right-click one of the Valley Bottom VBET layers -> Generate Centerline
- Use the centerline tool to create and save a centerline to your project
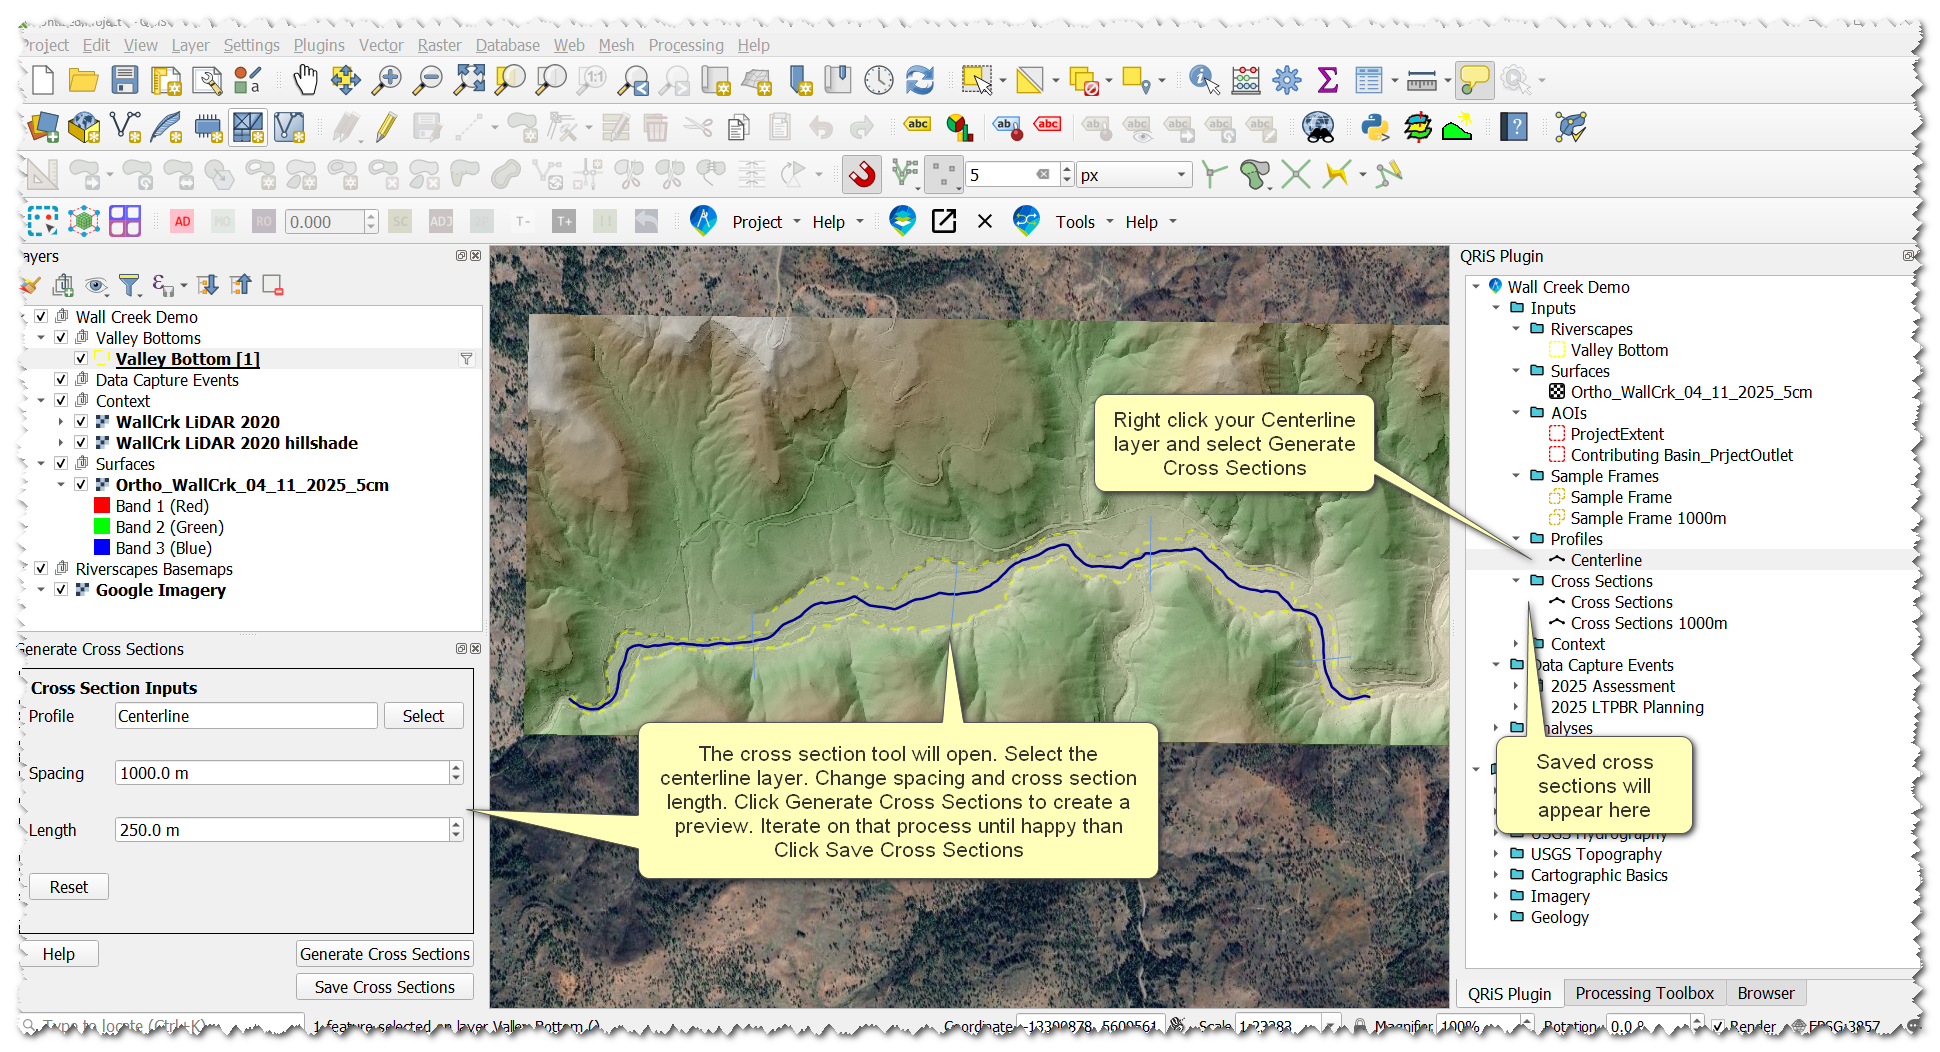
- Right-click the Centerline layer -> Generate Cross Sections
- Use the cross section tool to create and save cross sections to your project
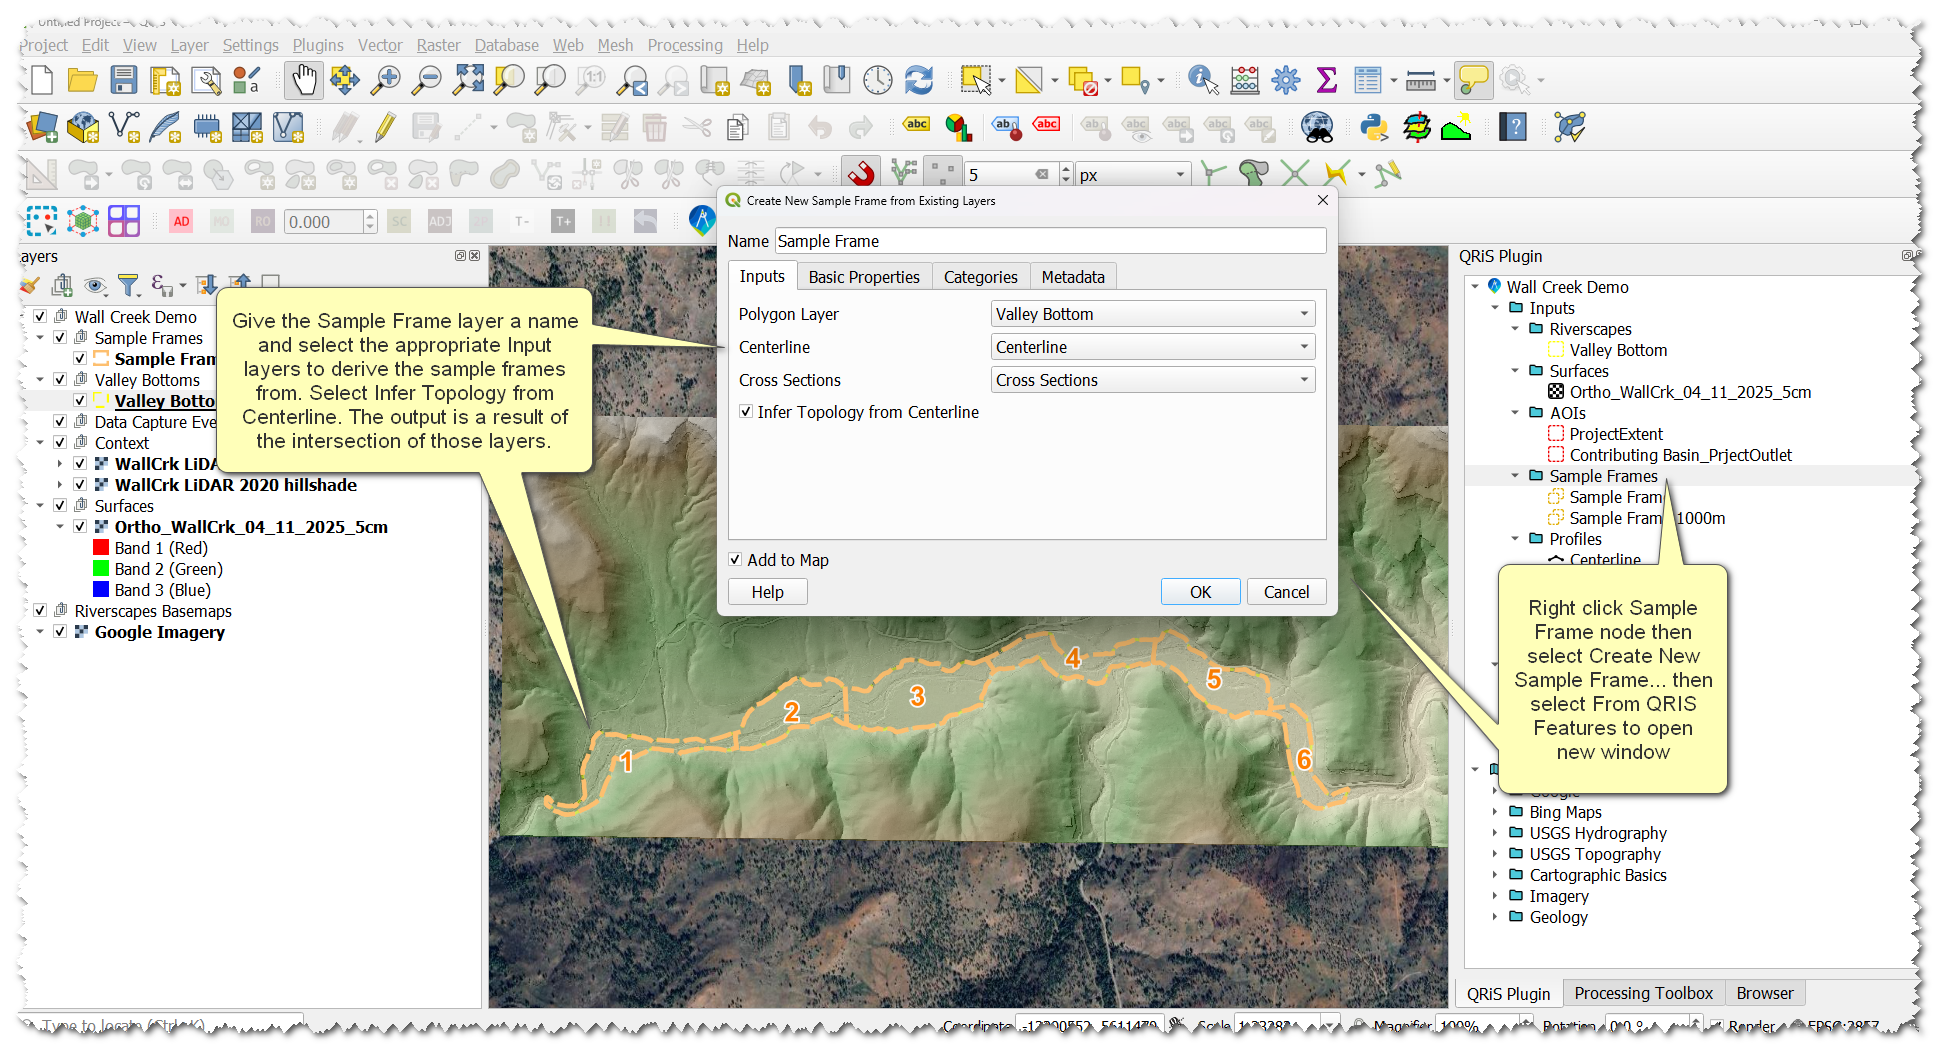
- Now, we have the building blocks to create a sample frame. Right-click the Sample Frames folder -> Create New Sample Frame -> From QRiS Features
- In the pop-up window, select the input layers to build a sample frame from(this will autopopulate with the layers you just created). Give it a helpful name. Check Infer Topology from Centerline.
- Do this for both of your VBET riverscape layers
Create a Sample Frame to Compare Carol and Pops Recovery Space
There are different ways to do this but the easiest uses a tool outside of QRIS to create a temporary layer to then import into the project
- Add your Coburn Creek Valley Bottom VBET layer to the map -> use the selection tool to select the feature -> search the processing toolbox for 'Select Extracted Features' tool.
- Make sure the correct layer is selected in the tool and click run (no need to save to a location, we just want a temporary layer)
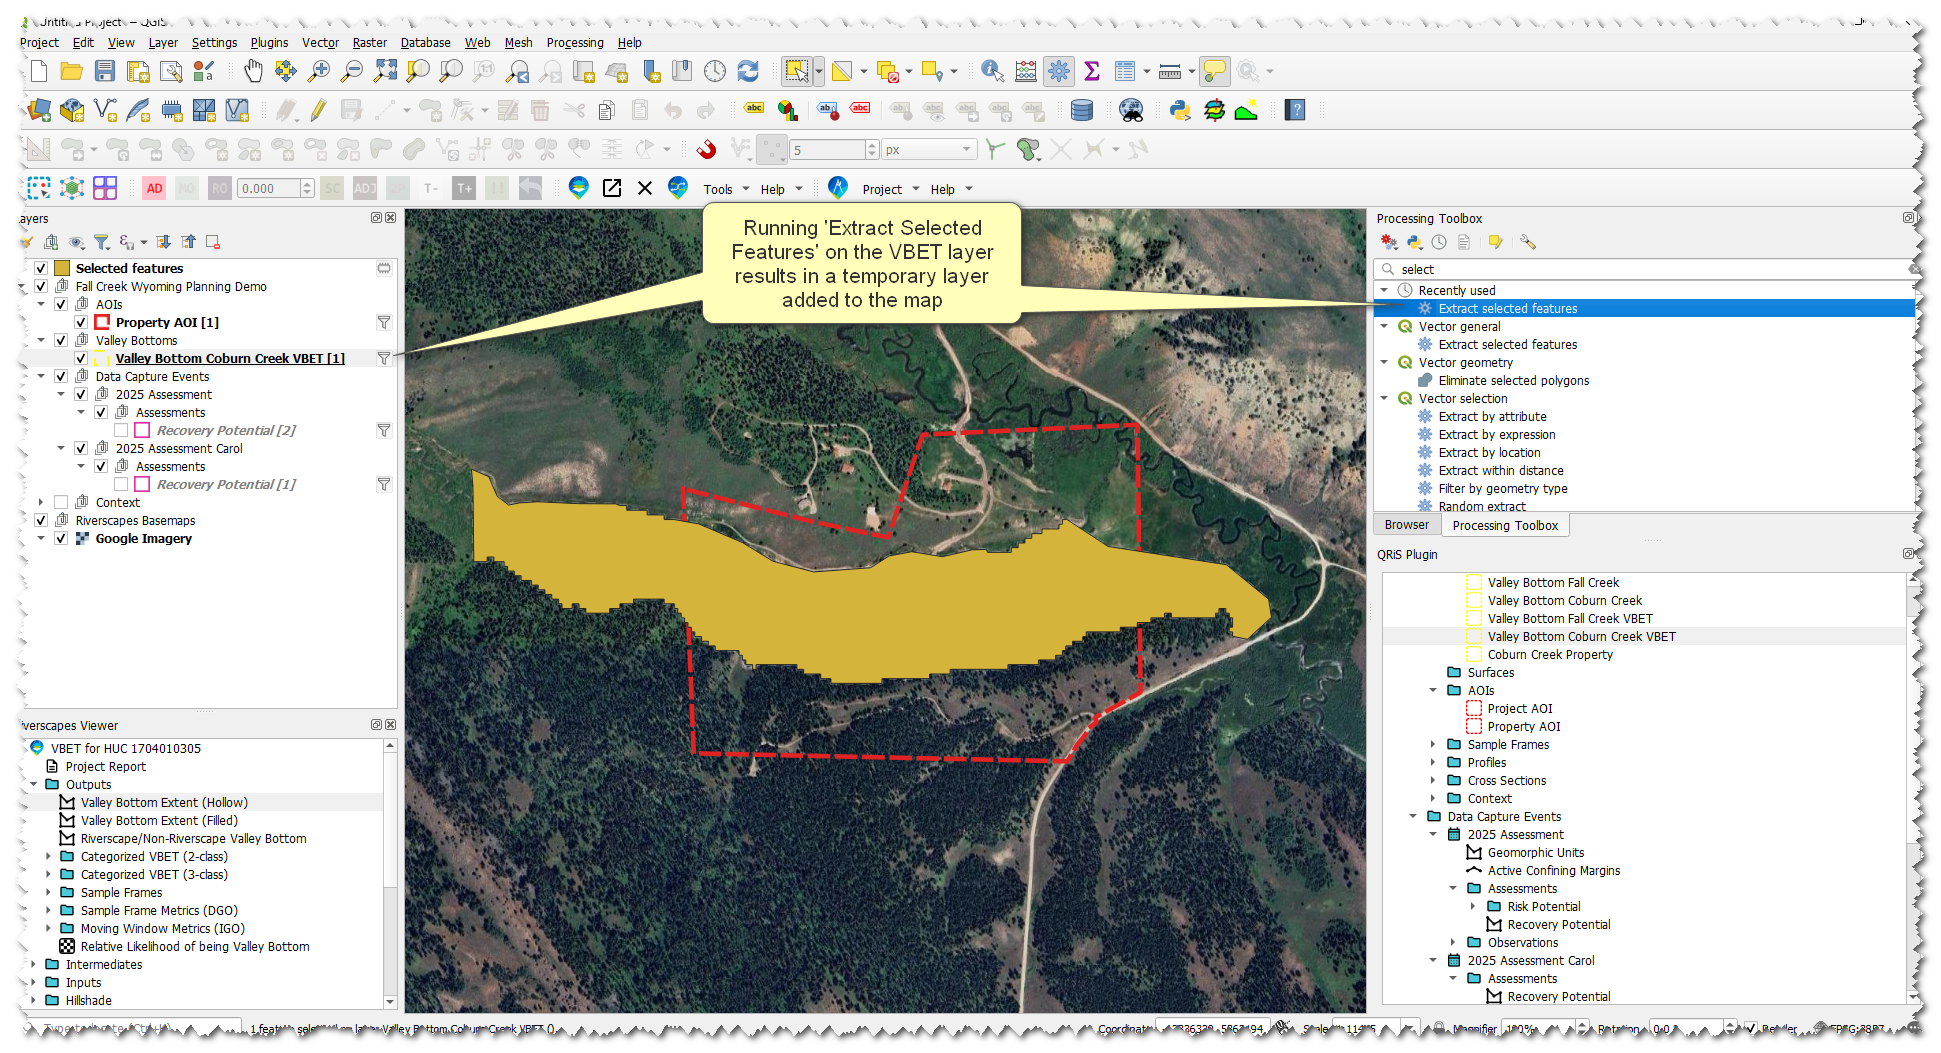
- Right-click the Sample Frames node -> Import Sample Frame from... -> select "Layer in Map"
- Choose the Temporary Layer in the dropdown, Give it a name like "SF Property", and select the "Property AOI" in the 'Clip to AOI' dropdown
- Leave all other fields as none and click ok
N. Analyses
Now that we have created sample frames we can use those to create an analysis and calculate metric values derived from features we digitized.
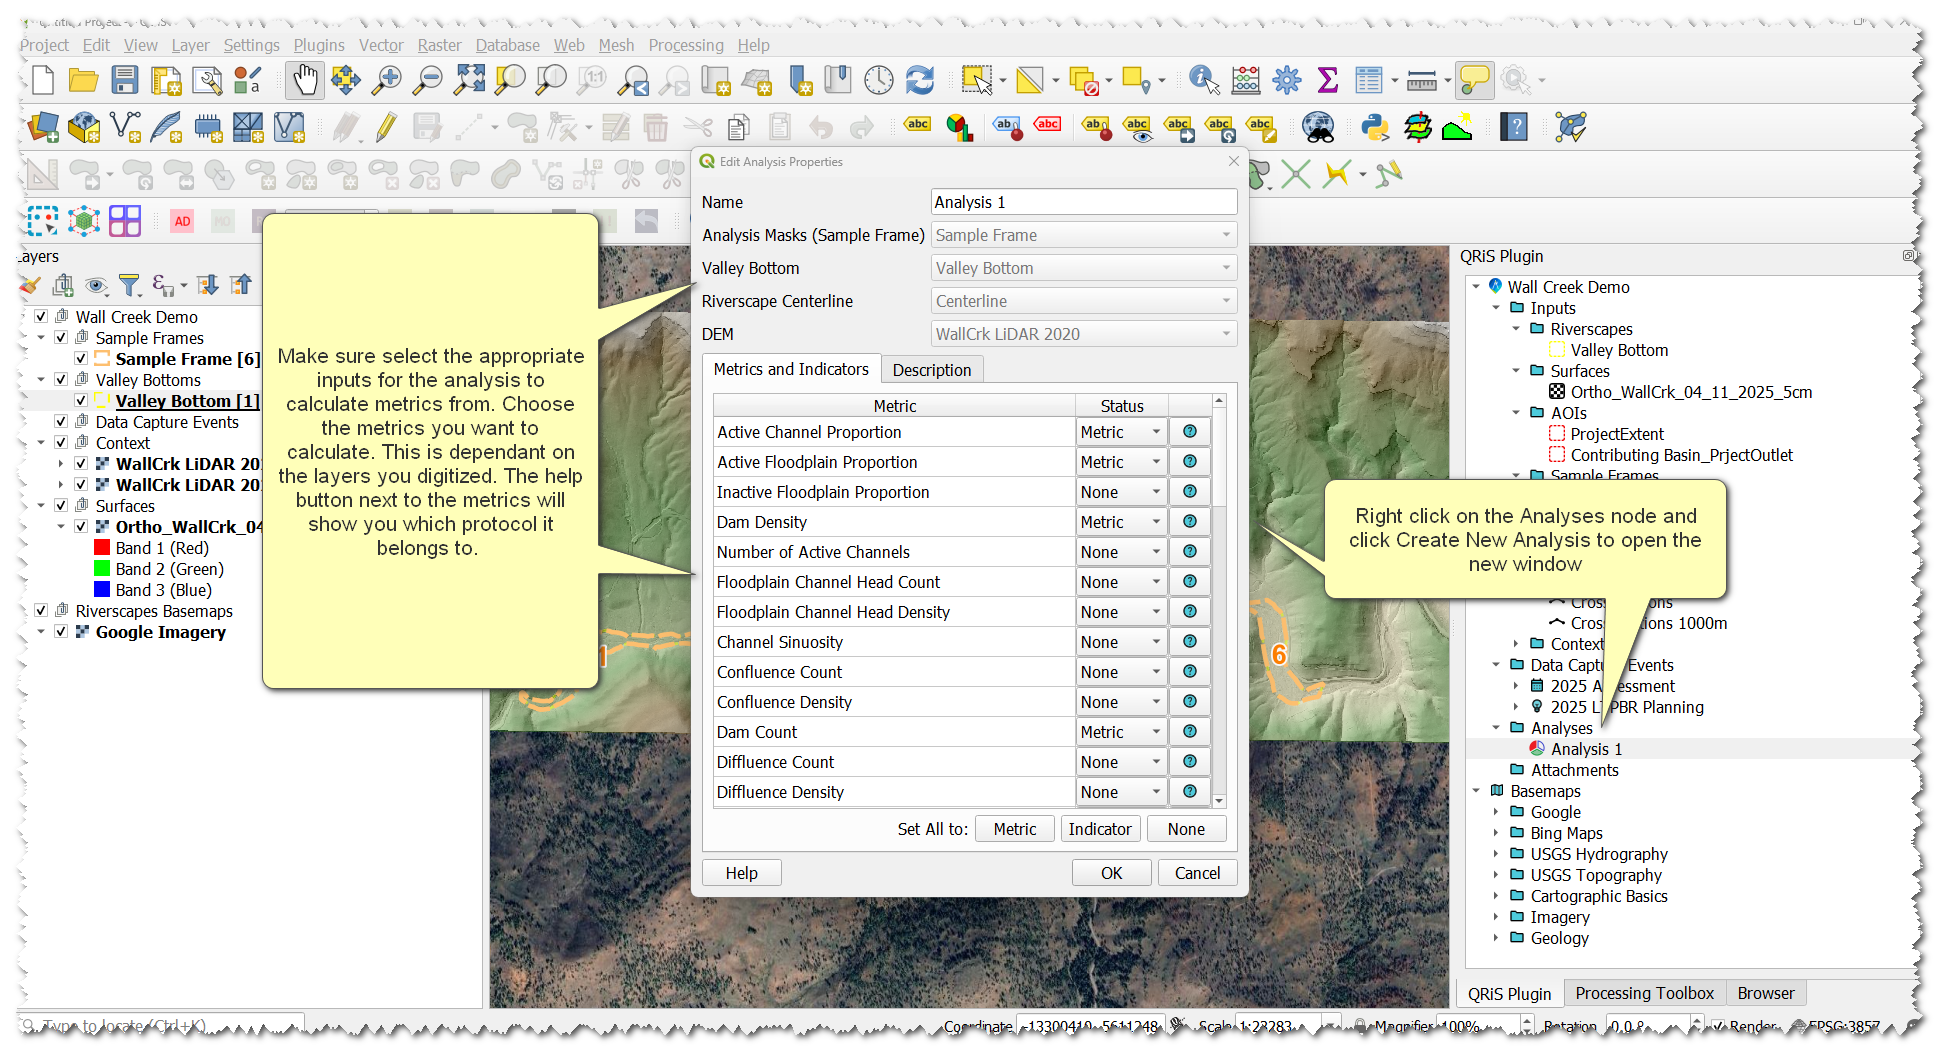
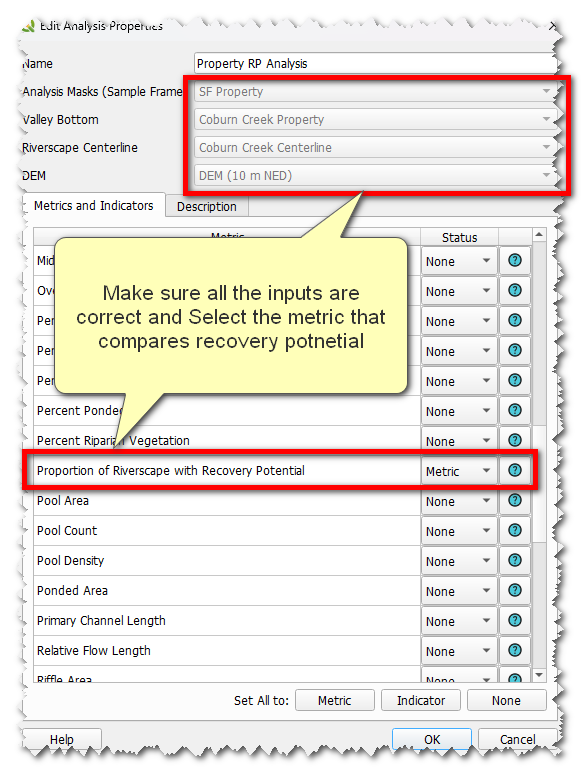
- Right-click the Analyses folder -> Create New Analysis
- Give the Analysis a name
- Select the sample frame layer you want to use to calculate metrics in
- Select the appropriate valley bottom layer, centerline layer, and DEM layer
- You will see a large list of metrics to select from. Click none at the bottom-right to set all metrics to none. Setting all to none allows you to go through and only choose the ones you want to calculate. Change the dropdown to metric on the following metrics:
- Active Floodplain Proportion
- Active Channel Proportion
- Proportion of Riverscape with recovery space
- Click OK
- On the window that pops up click calculate
- On the new window select All Sample Frames and click ok
- Values will calculate and populate in the table of metrics. Under the Mask Polygon Dropdown you can switch between your different sample frames to see the different metric values.
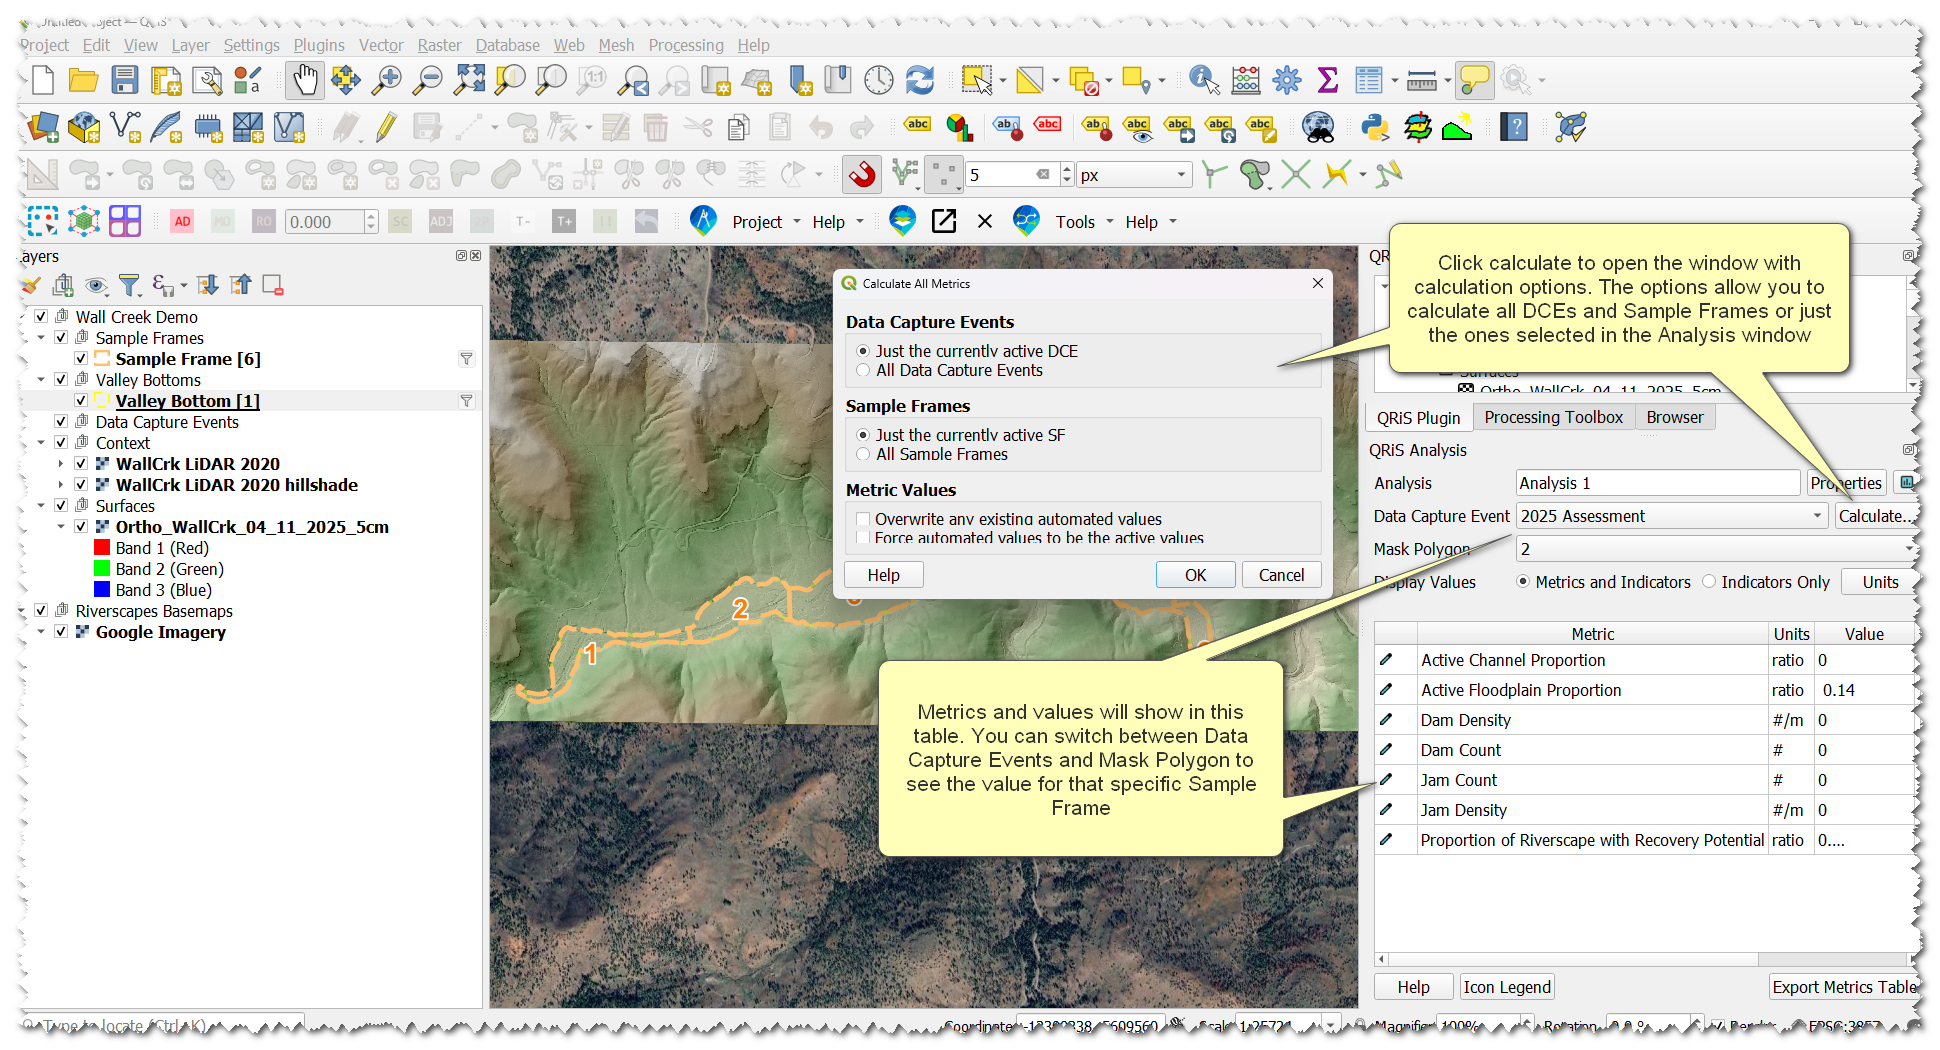
Run the Analysis three times:
- Run an analysis on Fall Creek (make sure to select all the appropriate inputs for Fall Creek )
- Run an analysis on Coburn Creek (make sure to select all the appropriate inputs for Coburn Creek)
- Run an analyis to compare Carol and Pops.
- Select the SF Property layer as the sample frame input and the Coburn Creek Valley Bottom and centerlines when creating the analysis.
- Select the Proportion of Riverscape with recovery space metric and set the rest to none, click ok
- Run the calculation, but this time check "All Data Capture Events" options, click OK
- Once it is calculated you can toggle between DCEs to see the differing values between Carol and Pops
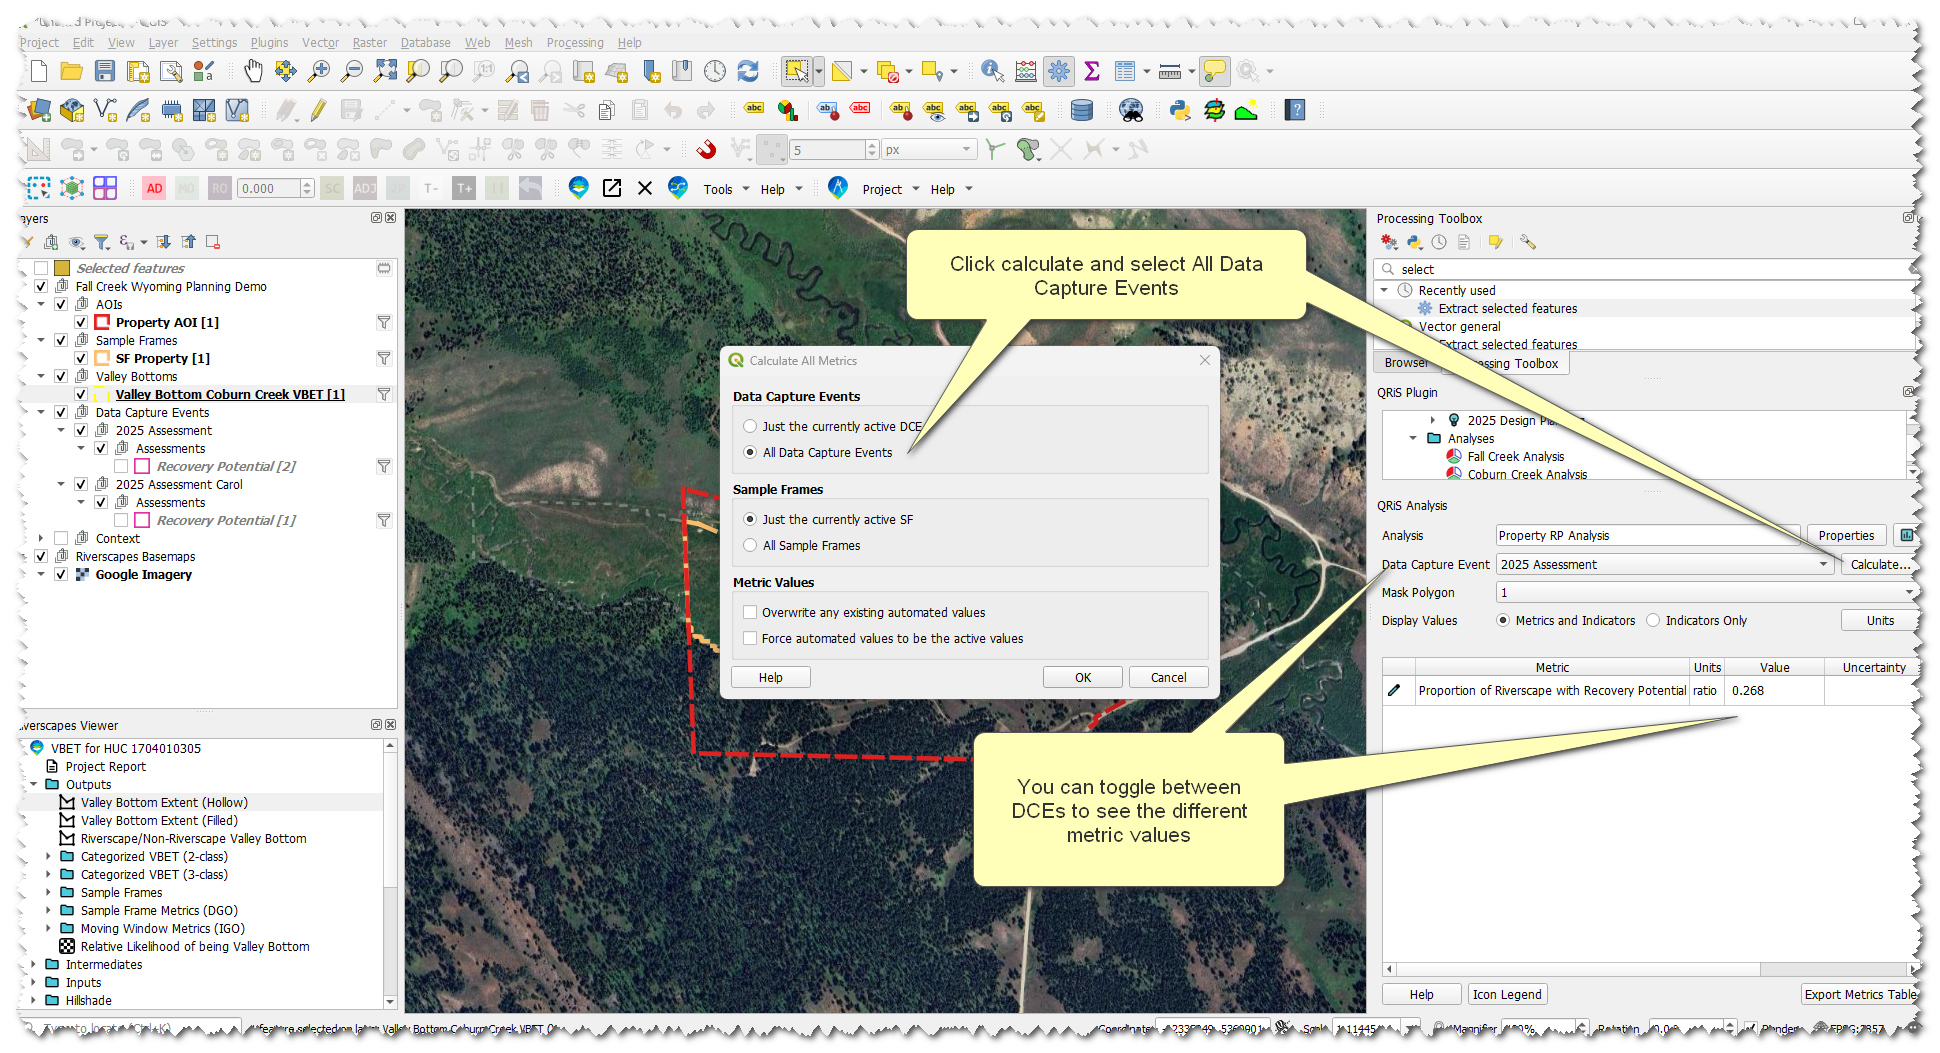
Metrics can be recalculated at any time and values can be overridden with manual values if necessary. More help can be found on the Analyses help page.