Catchment Delineations
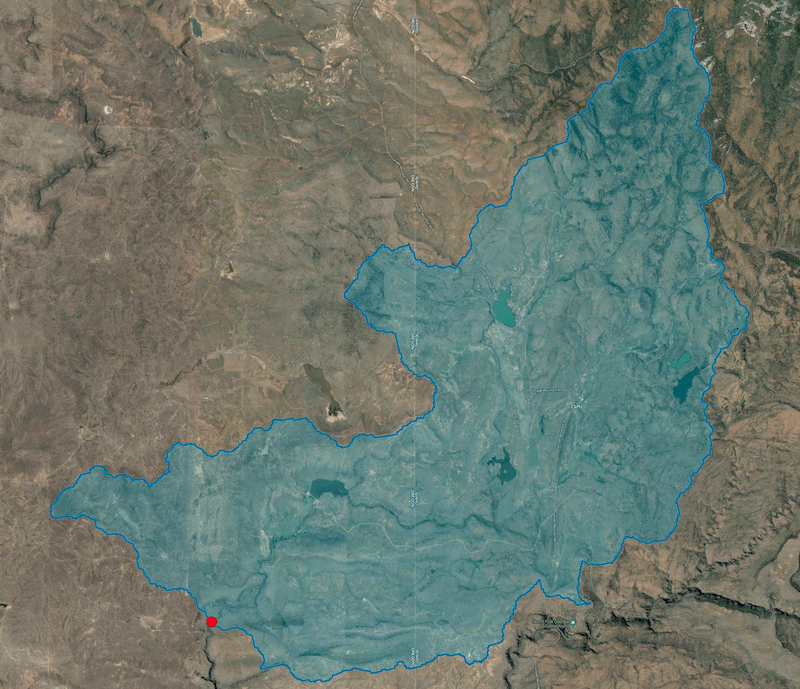
The Catchment Delineation tool takes a point that you click on the map and delineates the catchment upstream of that point. The tool uses the StreamStats service from the USGS to perform the delineation.
This feature is only available in the continental United States. See here for States covered and their status. Note, Florida, Texas and Nebraska are not currently operational.
Creating a Catchment
To delineate a catchment, first make sure that you have a QRiS project open. For this process to work it can be helpful to have a basemap loaded. To do this, click on the Basemap button in the toolbar and select a basemap from the list. A satellite or aerial basemap is recommended.
Next, zoom the map to the pour point (most downstream location) of the watershed. The pour point has to be defined extremely precisely, so it is recommended that you zoom in as far as possible. (See how StreamStats Works below.)
Expand the Context folder in the QRiS project tree and right click on the Catchment Delineationss item and select Run USGS StreamStats. A message will appear warning you that the tool will take a few minutes to run. Click OK to continue.

Click on the map at the location of the pour point. It's vital that you click precisely on the center of the river. Missing the river even slightly will result in the delineation of a catchment that represents the hillslope of the valley rather than the entire watershed. If you miss the river, you can click the Clear button in the toolbar and try again.
A form will appear for you to provide a name and an optional description or metadata for the watershed. During the inital download of the catchment, you have the following options:
- Delineate Catchment Only: This option will only delineate the catchment polygon geometry and pour point location. This option takes the shortest amount of time to run.
- Catchment with Basin Characteristics: This option will delineate the catchment polygon geometry and pour point location, as well as retrieve the basin characteristics for the catchment. These are regional statistics for the watershed that StreamStats makes available for driving streamflow calculations. The statistics available vary by region. This option takes a moderate amount of time (approximately 1-3 minutes) to run.
- Catchment with Basin Characteristics and Flow Statistics: This option will delineate the catchment polygon geometry and pour point location, as well as retrieve the basin characteristics and streamflow statistics for the catchment. The streamflow statistics are calculated using regional curves that relate basin characteristics to streamflow statistics. This option takes the longest amount of time to run (approximately 2-5 minutes).
Basin Characteristics and Flow Statistics can be always be downloaded at a later time, even if you initially choose to only download the catchment geometry.
Click OK to continue.

A progress bar will appear in the bottom right corner of the screen. The tool will take a few minutes to run. When it is finished, the catchment will be displayed on the map.
Catchment Properties, Basin Characteristics and Flow Statistics
You can edit the properties of the catchment or view the Basin Characteristics and Flow Statistics by right clicking on the catchment in the QRiS project tree and selecting Edit Catchment Properties. This will open the same form that you used to create the catchment. You can change the name and description of the catchment. Click OK to save your changes.
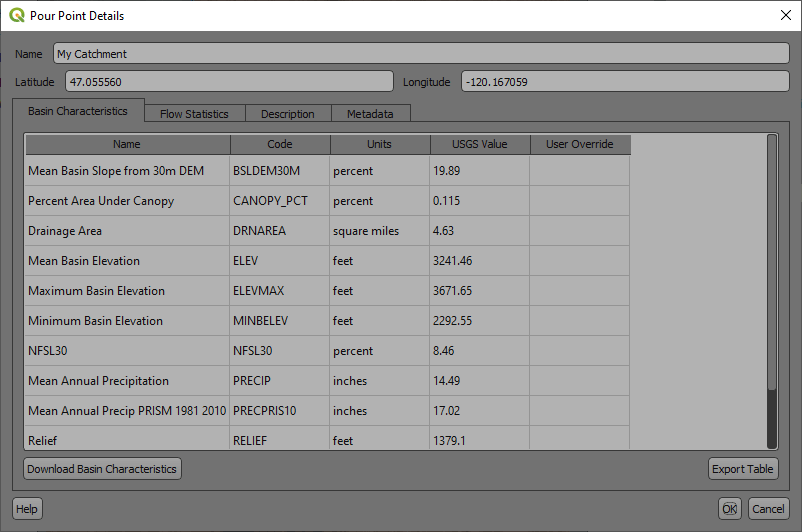
Basin Characteristics Tab The Basin Characteristics will be displayed in a table on the Basin Characteristics tab:
- Name: The name of the basin characteristic
- Code: The USGS code for the basin characteristic used accross the StreamStats API
- Units: The units for the basin characteristic
- USGS Value: The value for the basin characteristic provided by StreamStats
- User Override Value: A value that you can input to override the USGS value for the basin characteristic. If a user override value is provided, it will be used in place of the USGS value for Flow Statistics calculations.
Right clicking on a row in the table will give you the following options:
- Details: This will open a dialog with more details about the basin characteristic, including a description of the characteristic and how it is used in StreamStats calculations.
- Copy Value: This will copy the USGS value for the basin characteristic to your clipboard so that you can paste it into another application.
- Copy Value with Units: This will copy the USGS value and units for the basin characteristic to your clipboard so that you can paste it into another application.
Below the table is Download Basin Characteristics button. Clicking this button will download the basin characteristics for the catchment from StreamStats. This is useful if you initially chose to only download the catchment geometry but later want to get the basin characteristics without having to re-delineate the catchment.
On the lower right corner of the tab is a "Export Table" button. Clicking this button will allow the user to export the basin characteristics table as a CSV, JSON, or Excel file.
Flow Statistics Tab The Flow Statistics will be displayed in a table on the Flow Statistics tab:
- Statistic: The name of the flow statistic
- Value: The value (with units) for the flow statistic calculated by StreamStats using the basin characteristics and regional curves.
- Scenario: the scenario that the statistic belongs to.
- Region: The region that the statistic belongs to.
Right clicking on a row in the table will give you the following options:
- Details: This will open a dialog with more details about the flow statistic, including a the equation and Basin Characteristics used to calculate the statistic.
- Copy Value: This will copy the value for the flow statistic to your clipboard so that you can paste it into another application.
- Copy Value with Units: This will copy the value and units for the flow statistic to your clipboard so that you can paste it into another application.
Below the table is a Recalculate Flow Statistics button. Clicking this button will recalculate the flow statistics for the catchment using the basin characteristics and regional curves. This is useful if you have provided user override values for any of the basin characteristics and want to see how that affects the flow statistics.
On the lower right corner of the tab is a "Export Table" button. Clicking this button will allow the user to export the flow statistics table as a CSV, JSON, or Excel file.
Promote to AOI
You can promote the catchment to an AOI by right clicking on the catchment in the QRiS project tree and selecting Promote to AOI. This will create a new AOI in the QRiS project tree and add the catchment to it. You can then use the AOI to clip other datasets as you bring them into the project.
A common workflow is to delineate two catchments, one at the top and one at the bottom of your riverscape. You can then use QGIS editing capabilities to subtract the two polygons from each other to create a single polygon that represents just the hillslope that drains into your riverscape.
Delete a Catchment
You can delete a catchment by right clicking on the catchment in the QRiS project tree and selecting Delete Catchment. This will remove the catchment from the QRiS project tree and from the map.
How StreamStats Works for Catchment Delineation
StreamStats stores a raster representation of the streams for the entire continental United States. When you click on the map, the tool uses the coordinates of the click to determine the pixel in the raster that you clicked on. It then uses the raster to determine the upstream and downstream neighbors of that pixel. It then uses the neighbors to determine the upstream and downstream neighbors of those pixels, and so on. This process continues until the tool reaches the edge of the raster. The result is a delineation of the catchment upstream of the pixel that you clicked on.
Therefore it is vital that when you click on the map that you are clicking on one of the raster cells that StreamStats has stored as a river cell. Missing the river will cause StreamStats to perform a simple topographic analysis of the hillslope rather than the entire watershed.
StreamStats hosts an online interactive tool available in the Map Tools section of the USGS website.
Using StreamStats for Basin Charactersics and Streamflow Statistics
As of March, 2026, and Version 1.2.3.1 of QRiS, the USGS updated their StreamStats API, so that the streamflow statistics actually works!
See video for how to use the Catchment Delineation tool to get basin charactersics for your catchment, as well as stream flow statistics. You can also re-calculate the stream flow statistics using the same regional curves but user-defined overide values for Basin Characteristic parameters.