Data Capture Events
Efficient and streamlined collection of geospatial data is critical to the success of any river restoration project. QRiS was designed to make this process as easy as possible.
There are several phases to a river restoration project, such as planning, implementation and monitoring. QRiS helps you collect data in each of these phases by organzing data into a series of data capture events (DCE). An event might be an afternoon spent mapping a reach of river, or a day spent surveying a restoration site. It might be a planning event or capturing an as-built design. Post implementation you might have one or more monitoring events and over time you might repeat this cycle with subsequent phases that repeat some or all of these.
The central goal of QRiS is to help you capture the geospatial data that is appropriate for the phase of your project. There are suggested feature classes and attributes for each event type, but you can customize these to suit your needs.
Once you have digitized the features for several data capture events over time, you can generate an analysis to compare the changes in your riverscape over time.
Create a Data Capture Event
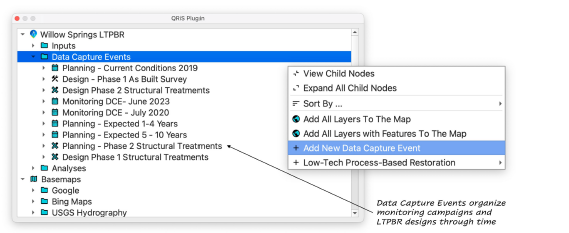
Right click on the Data Capture Events folder in the QRiS project tree and select Add New Data Capture Event. Provide a name for the event and pick the layers that you want to include. You can change which layers are included in an event at any time by right clicking on the event and selecting Edit Data Capture Event. Once you have created your event, it appears in the QRiS project tree with all the layers that you included shown below it.
Layers
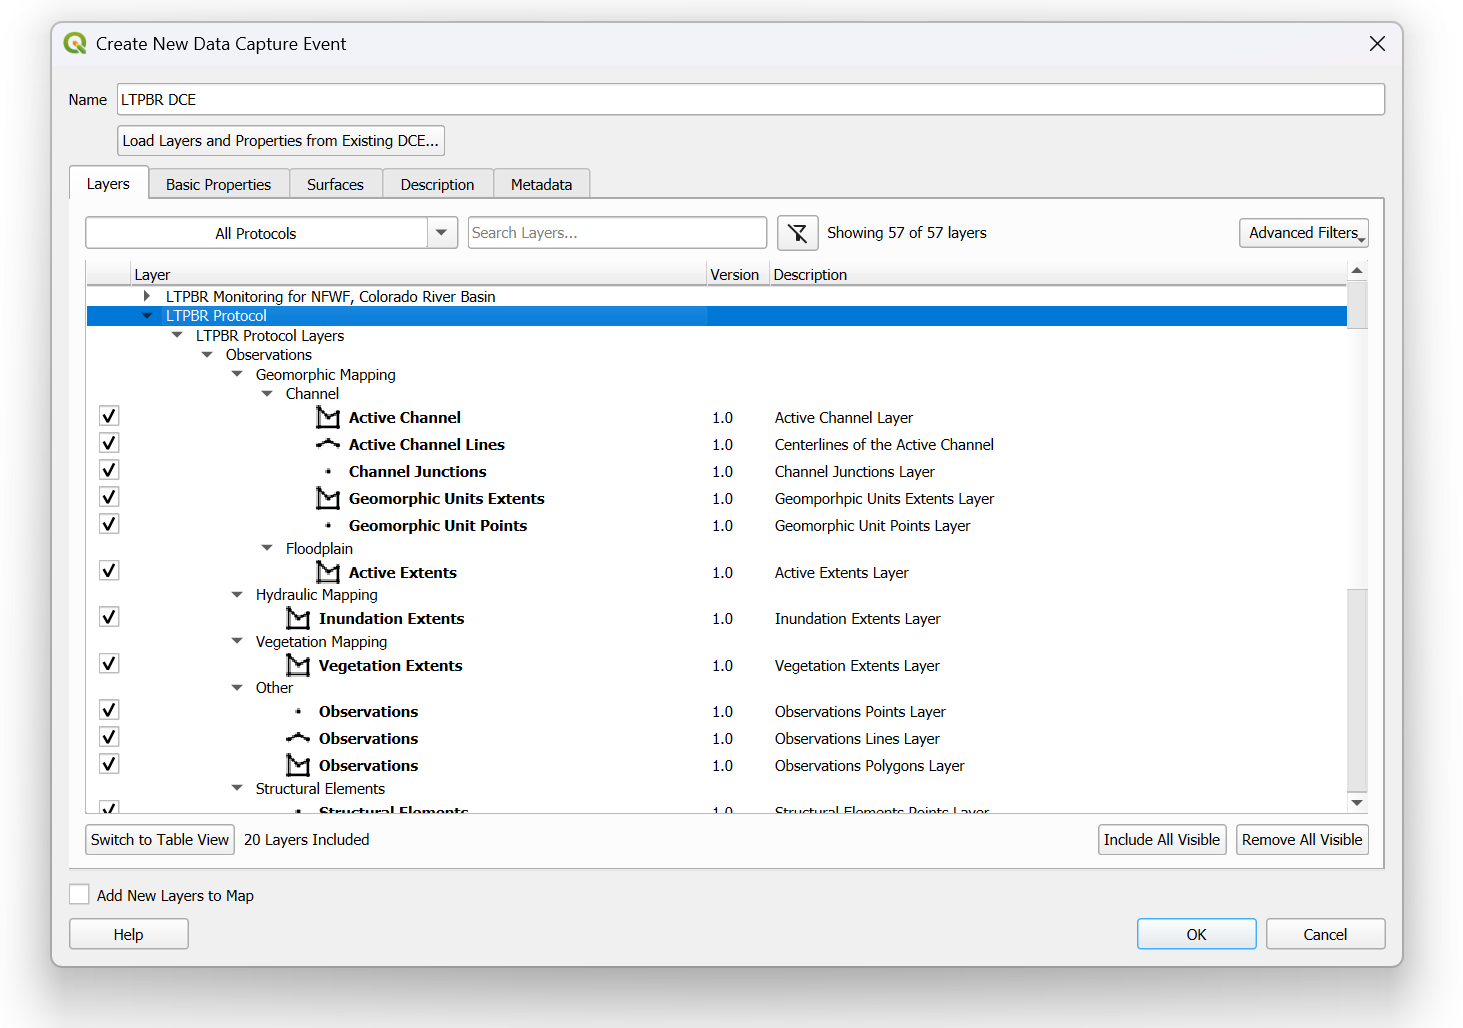
After creating a Data Capture Event, a dialog window will appear where you customize the DCE with layers sourced from the protocol library. This includes both a tree view (shown in the screenshot) and a table view. You have the flexibility to use as many layers as needed, drawing from a single protocol or combining elements from multiple protocols. Use the upper left drop down menu to select the protocol(s) you want to use. You can add layers to the DCE by expanding the protocol tree and selecting layers of interest (i.e., checking the layer box) or search for specific layers in the search bar. Under Advanced Filters, the user can filter layers that have been selected or ones contained within experimental protocols.
In the bottom of the dialogue window, the user can include or remove all protocol layers by selecting the Include All Visible and Remove All Visible options respectively. To the left, the user can toggle between the tree and table views by clicking on the Switch to Tree/Table View. Finally, the user can select the Add New Layers to Map option in the bottom left-hand corner to add all selected layers to the map panel.
Once you have selected the layers, right click to add any layer to the map and starting digitizing features using the built in QGIS editing capabilities. After each feature is digitized a custom field form will appear to capture the attributes for that feature. The fields have been carefully curated for the specific feature type and event type.
You can always go back and edit layers and features. You can also take advantage of all of the powerful QGIS editing tools during editing; merging, subtracting, splitting, etc.
Basic Properties
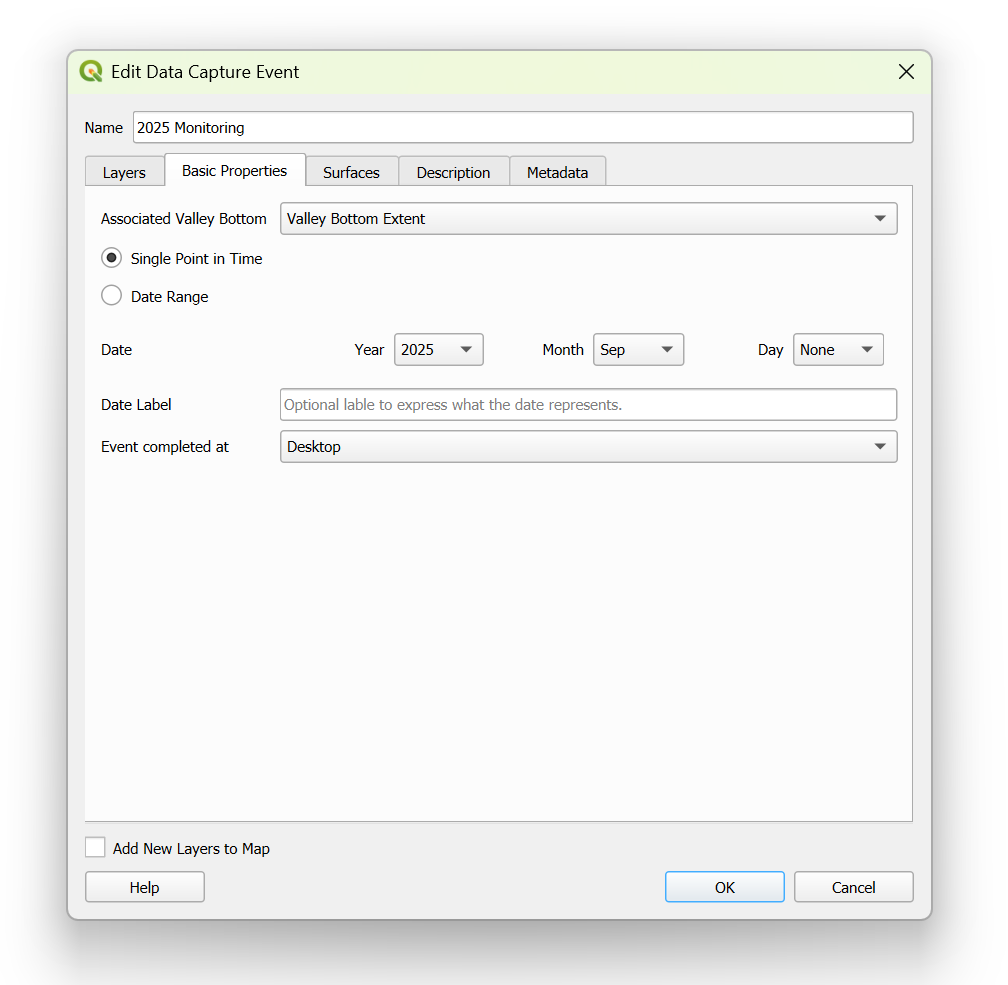
The valley bottom polygon associated with your DCE can be selected under the Associated Valley Bottom section. This defines the boundary of your DCE and is linked to your DCE layers so it will be rendered alongside them in the map panel.
Choose whether the event represents a single point in time or a data range under the Date section. You can choose the specificity of the dates you want to capture. For example, you might want to capture the year and month of a planning event, but only the year of a monitoring event.
Under Date Label, you can specify whether the event represents the past, present or future. This is helpful context for consumers of the data to know the context of what is being represented.
Finally, you can specify whether the event was captured in the field or in the office (desktop).
Surfaces
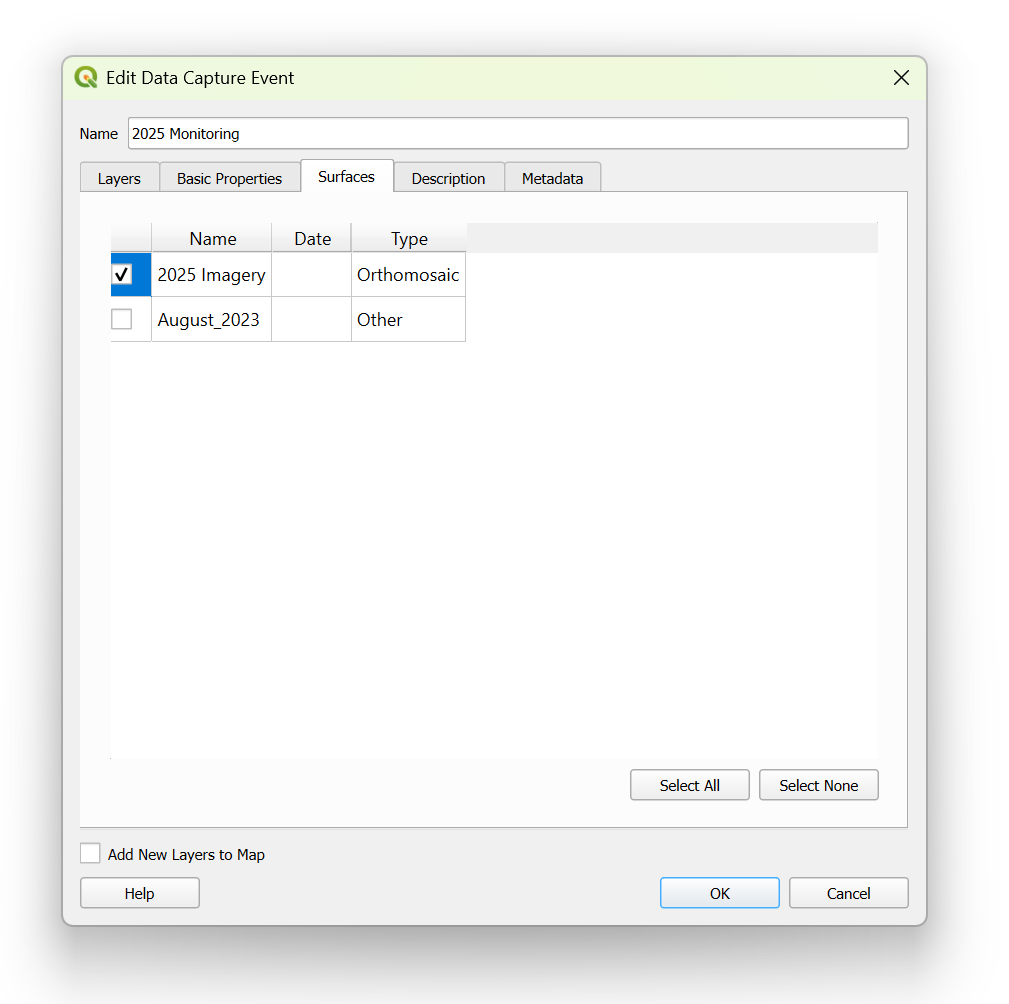
Typically you will want to include a surface for each event. This is the raster imagery that you will use to digitize features for your DCE. It might be a historic photograph, drone image or satellite dataset. You can pick one or more surfaces if you are are basing your work on multiple sources.
Description
Descriptive narrative related to the context, considerations, and constraints associated with the DCE. Descriptions may include (but not limited to) imagery context, digitizing limitations, monitoring information, etc.
Metadata
Associated metadata with your DCE. This can include (but not limited to) website links, file & folder locations, data sources, etc. Also comes with read-only QRiS metadata populated with information from the interface.
Digitizing Considerations
When digitizing it's important to think about the layer being digitized and if there are specific considerations that need to be taken into account. In particular, you should consider the following:
- During analyses Data Capture Event features are processed within sample frame polygons. For example, structure points are counted within each sample frame polygon and vegetation types are summarized by area within each polygon. Therefore, it can be useful to have the sample frame polygons added to the map while digitizing event features.
- Related to the previous point, it's important for some feature types to maintain mutual exclusivity to avoid "double counting" during analyses. For example, if you are digitizing active and inactive floodplains, you should avoid gaps and overlaps between the two feature types. This can be accomplished by using the topology checker during editing.
Help
If users need help or assistance with LTPBR DCEs or the interface, click on the Help button in the lower left hand corner of the interface window.