Site Scale Planning with Riverscapes Studio
Webinar Details

See Webinar Event Details on RC
September 24, 2025 Webinar - hosted by the Riverscapes Consortium
Webinar Sponsored By:
Webinar Presenters:
Description
This webinar will discuss how to integrate VBET and Riverscapes Studio (QRiS) into NRCS-compliant workflows to improve site-scale planning. Participants will learn about:
- Using nationwide VBET (thanks to NRCS CEAP-funded availability)
- Reading riverscapes and assessing opportunities within Riverscapes Studio (QRiS)
- Integrating Riverscapes Studio (QRiS) workflows into the NRCS Conservation Planning Process for LTPBR projects
Acknowledgements
Funded by the NRCS CEAP Wetlands program, this session is open to everyone, and targeted towards practitioners working on conservation planning with NRCS standards (e.g. Conservation Planning Process).
This work was supported by grants from the USDA NRCS Conservation Effects Assessment Project (CEAP) Wetlands (Grant NR213A750023C005) and Watersheds (Grant NR203A750023C01) programs. The findings and conclusions in this webinar are those of the authors and should not be construed to represent any official USDA or U.S. Government determination or policy.
Resources
Data Used in Webinar
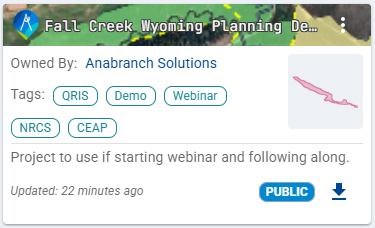
Fall Creek Demo - Riverscapes Studio Projects
Riverscapes Studio Collection with Starter & Full Project for Fall Creek, Wyoming with context layers.
Fall Creek - Riverscape Models for Context
Collection of Riversapes Context and Valley Bottom and Antro Projects from Data Exchange
Webinar Slides
Video Recording of Webinar
Step-By-Step Tutorial
The step-by-step tutorial has two parts. The written portion is a simple form of the tutorial meant as a way to guide you through the steps in a brief and concise way. The video component is much more in depth and has more discussion about concepts and nuances that are not mentioned in the written portion.
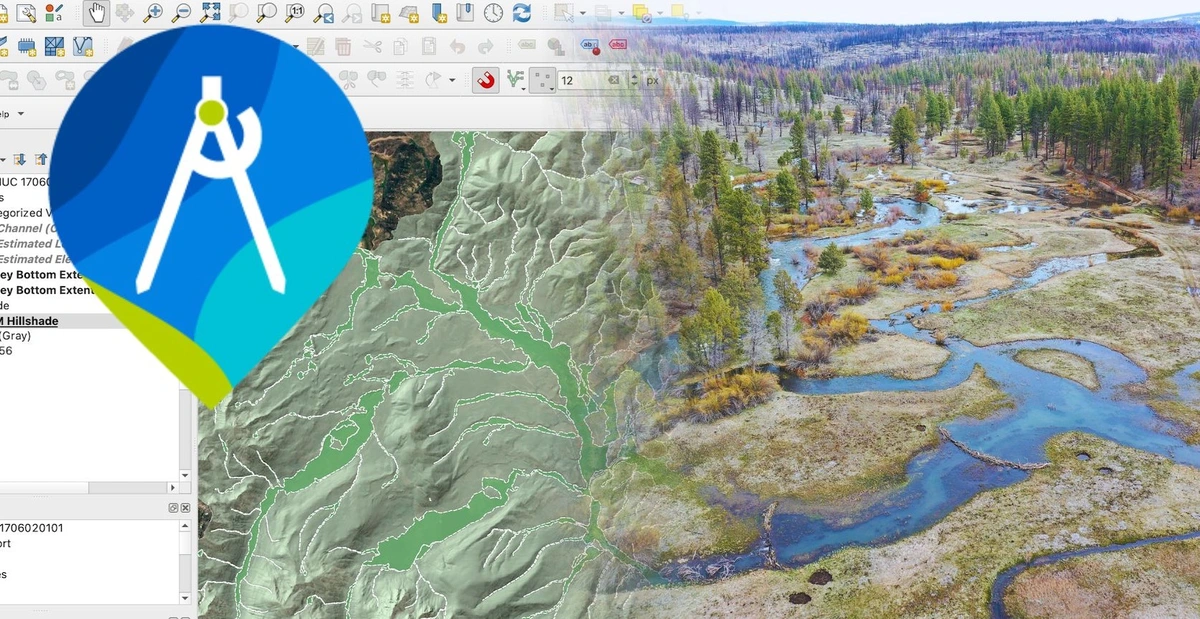
Install and Open Project
QRiS and Riverscapes Viewer are plugins to QGIS. You will download and install them directly in QGIS.
- In the QGIS menubar at the top of the page, Plugins > Manage and Install Plugins.
- Install the Riverscapes Viewer plugin first. Search for Riverscapes Viewer and click the Install button. This is a required dependency for QRiS.
- Install the QRiS plugin next. Follow the same steps to Plugins > Manage and Install Plugins and search for QRiS. Click the Install button.
- Create a new project, or open the one provided after downloading
Download Riverscapes Projects and Explore Context layers
- Under the QRiS Plugin pane, right click on your project name, and select Browse Data Exchange Projects. This will open a Data Exchange window in your web browser, zoomed to the map area open in QGIS.
- In the Data Exchange, you can zoom out as needed to be sure you select the HUC 10 you’re working within. Click your HUC 10 and find a Valley Bottom (VBET) project. Click the project. A banner at the top of the project page will alert you if there is a newer version of the Valley Bottom project run. Download your Valley Bottom project.
- Follow the same steps to find and download the Riverscapes Context and Anthro Projects as well.
Populate Project with Context layers
- Open your Riverscapes Context Project throught the Riverscapes Viewer Plugin by browsing to and selecting the project.rs.xml
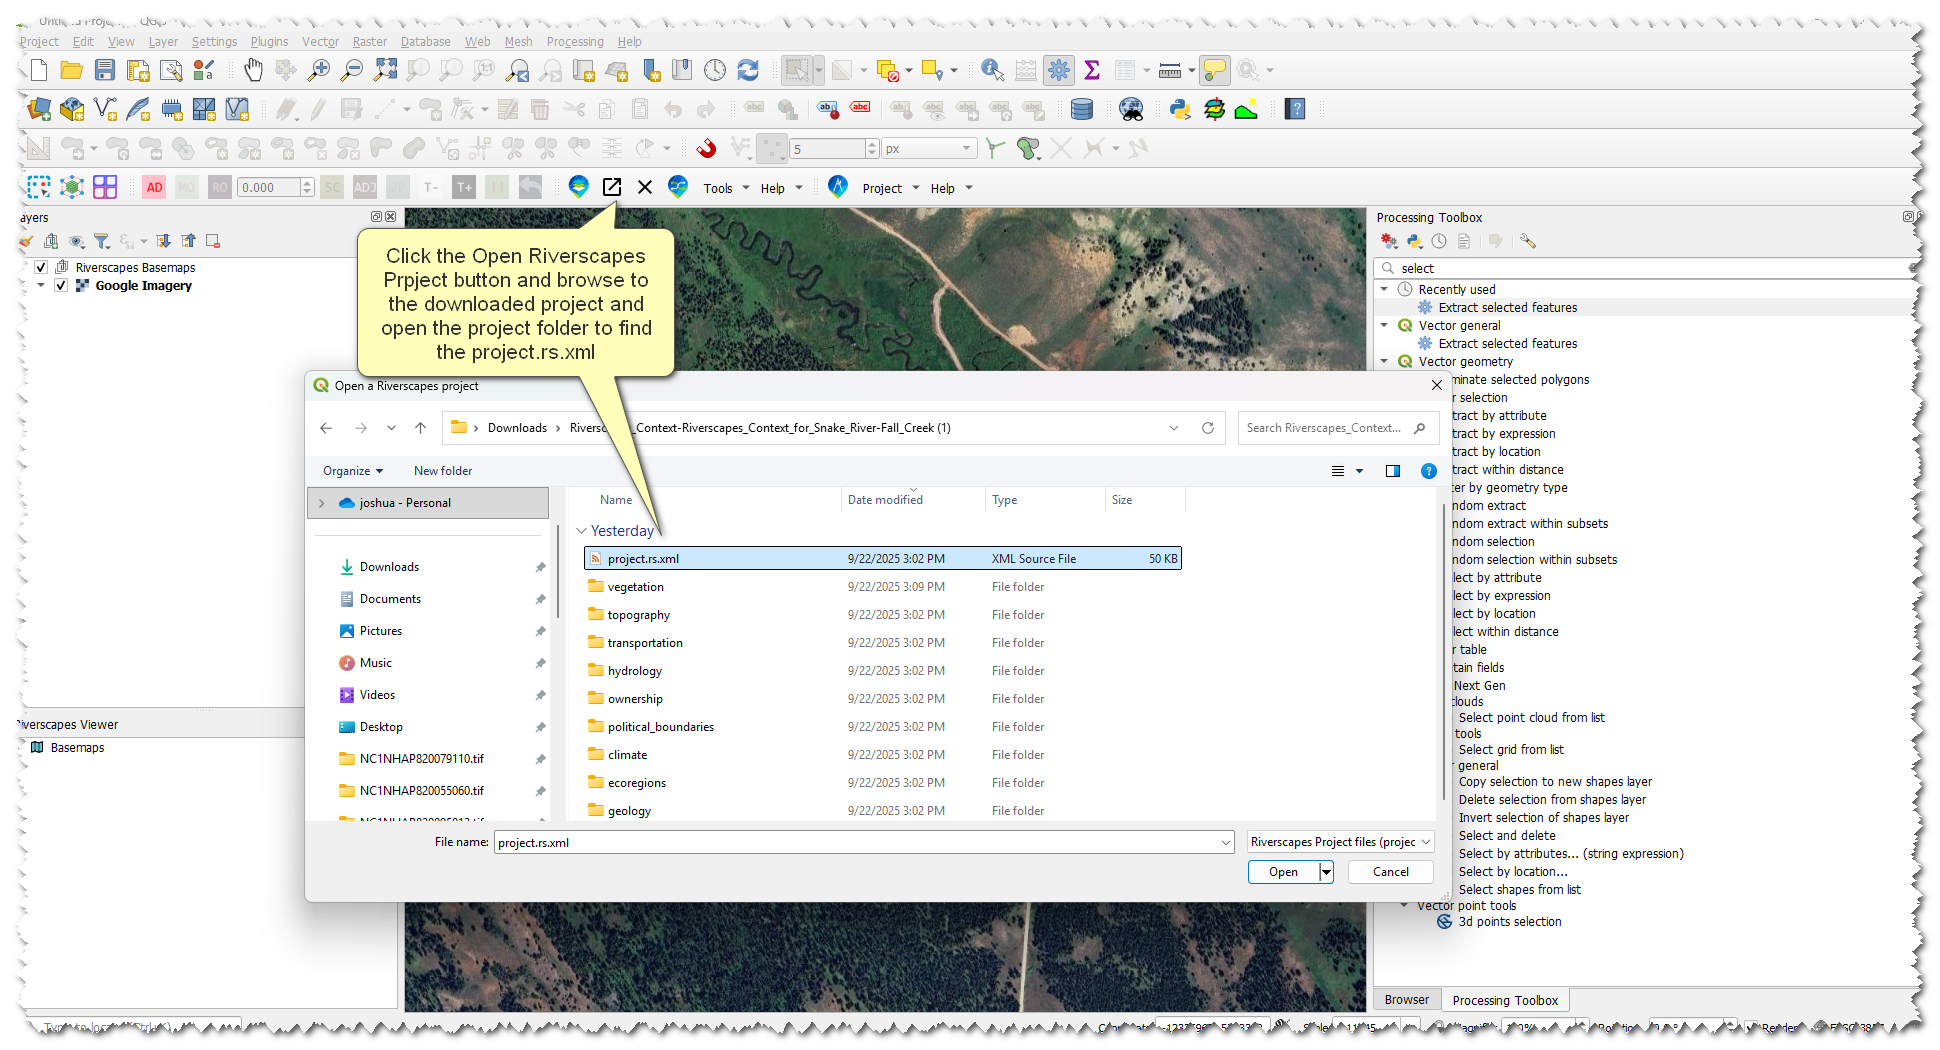
- Browse the layers and double click on them to add them to the map, look for layers that help add context to our riverscape
- Once you have located contextual layers in the riverscapes project we are going to import them into our QRIS project
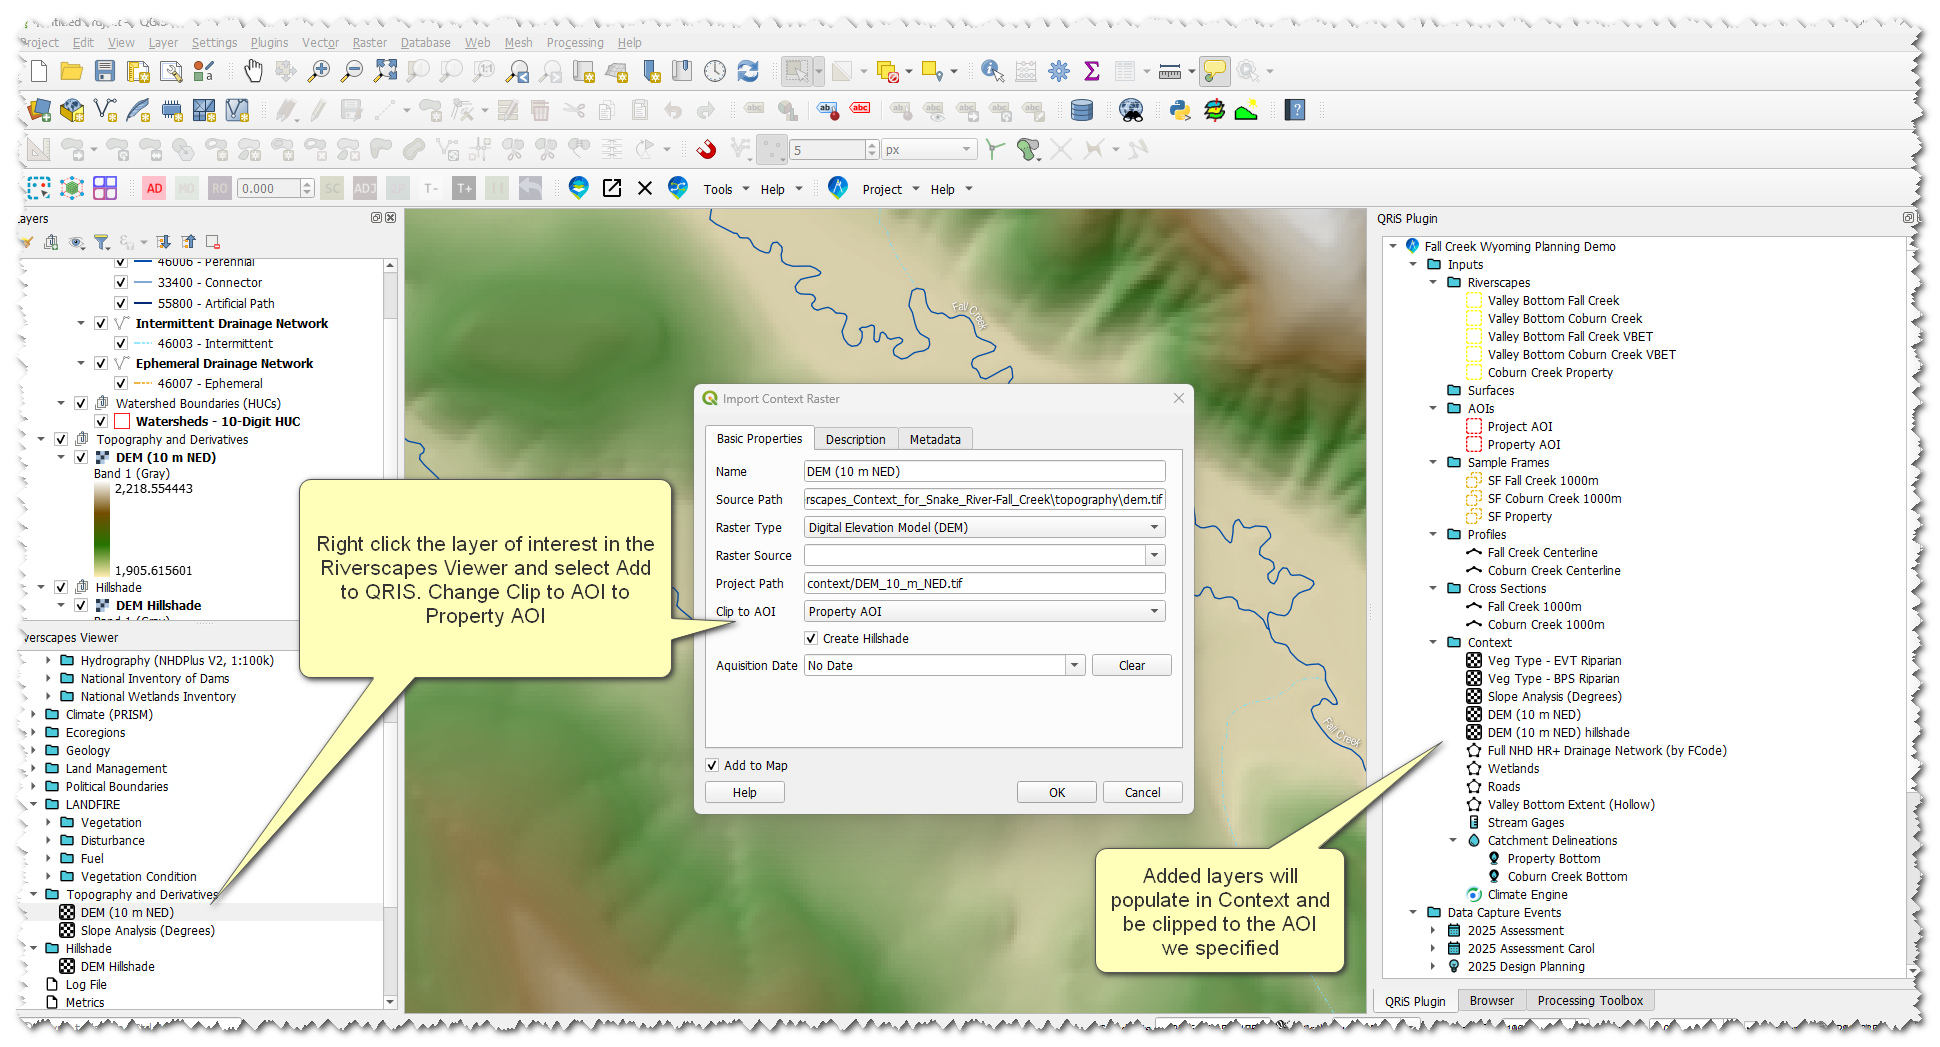
- Right-click the DEM layer under Topography and Derivatives -> Add to QRIS
- Change the 'Clip to AOI' dropdown to our Project AOI -> click OK
- Repeat this process for Slope Analysis, Wetlands, Existing Riparian and Historic Riparian.
Create a Data Capture Event
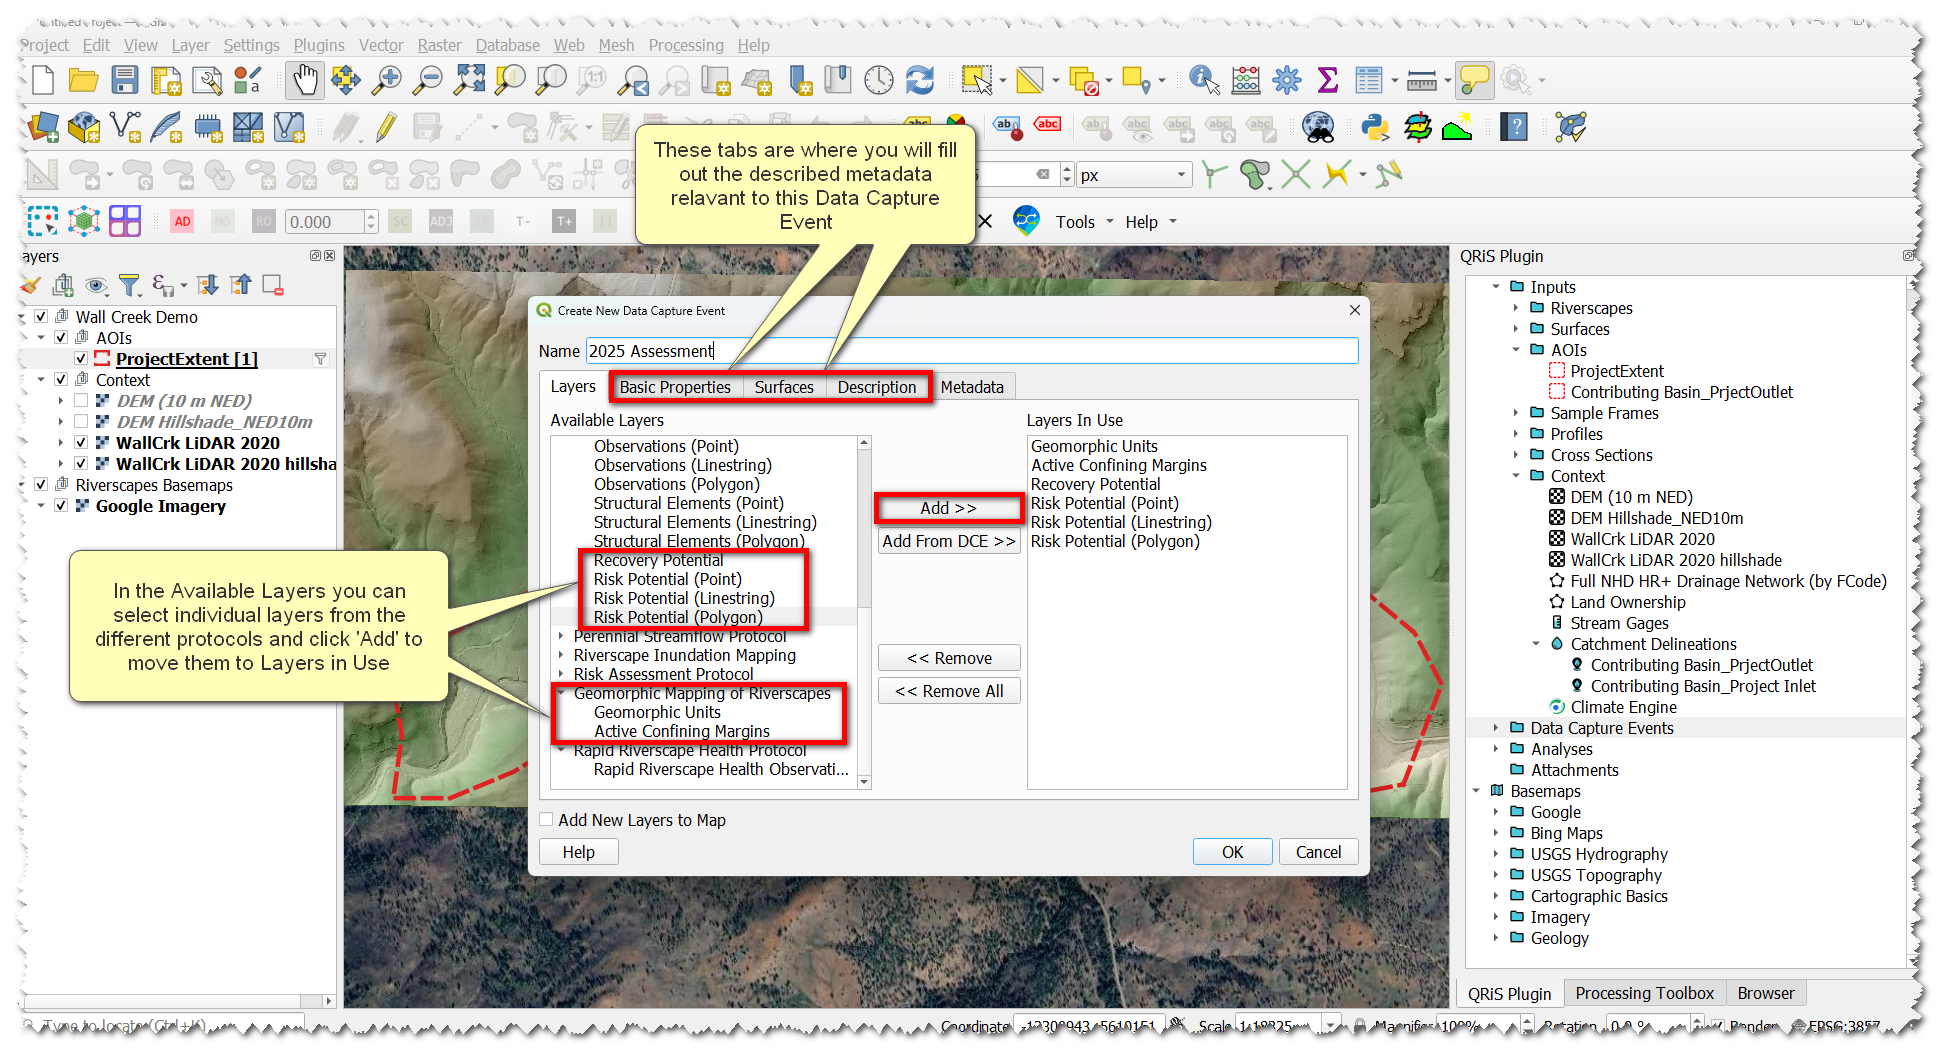
- Right-click Data Capture Events node -> Add New Data Capture Event
- Select Geomorphic Mapping of Riverscapes in the pop-up window. Click Add.
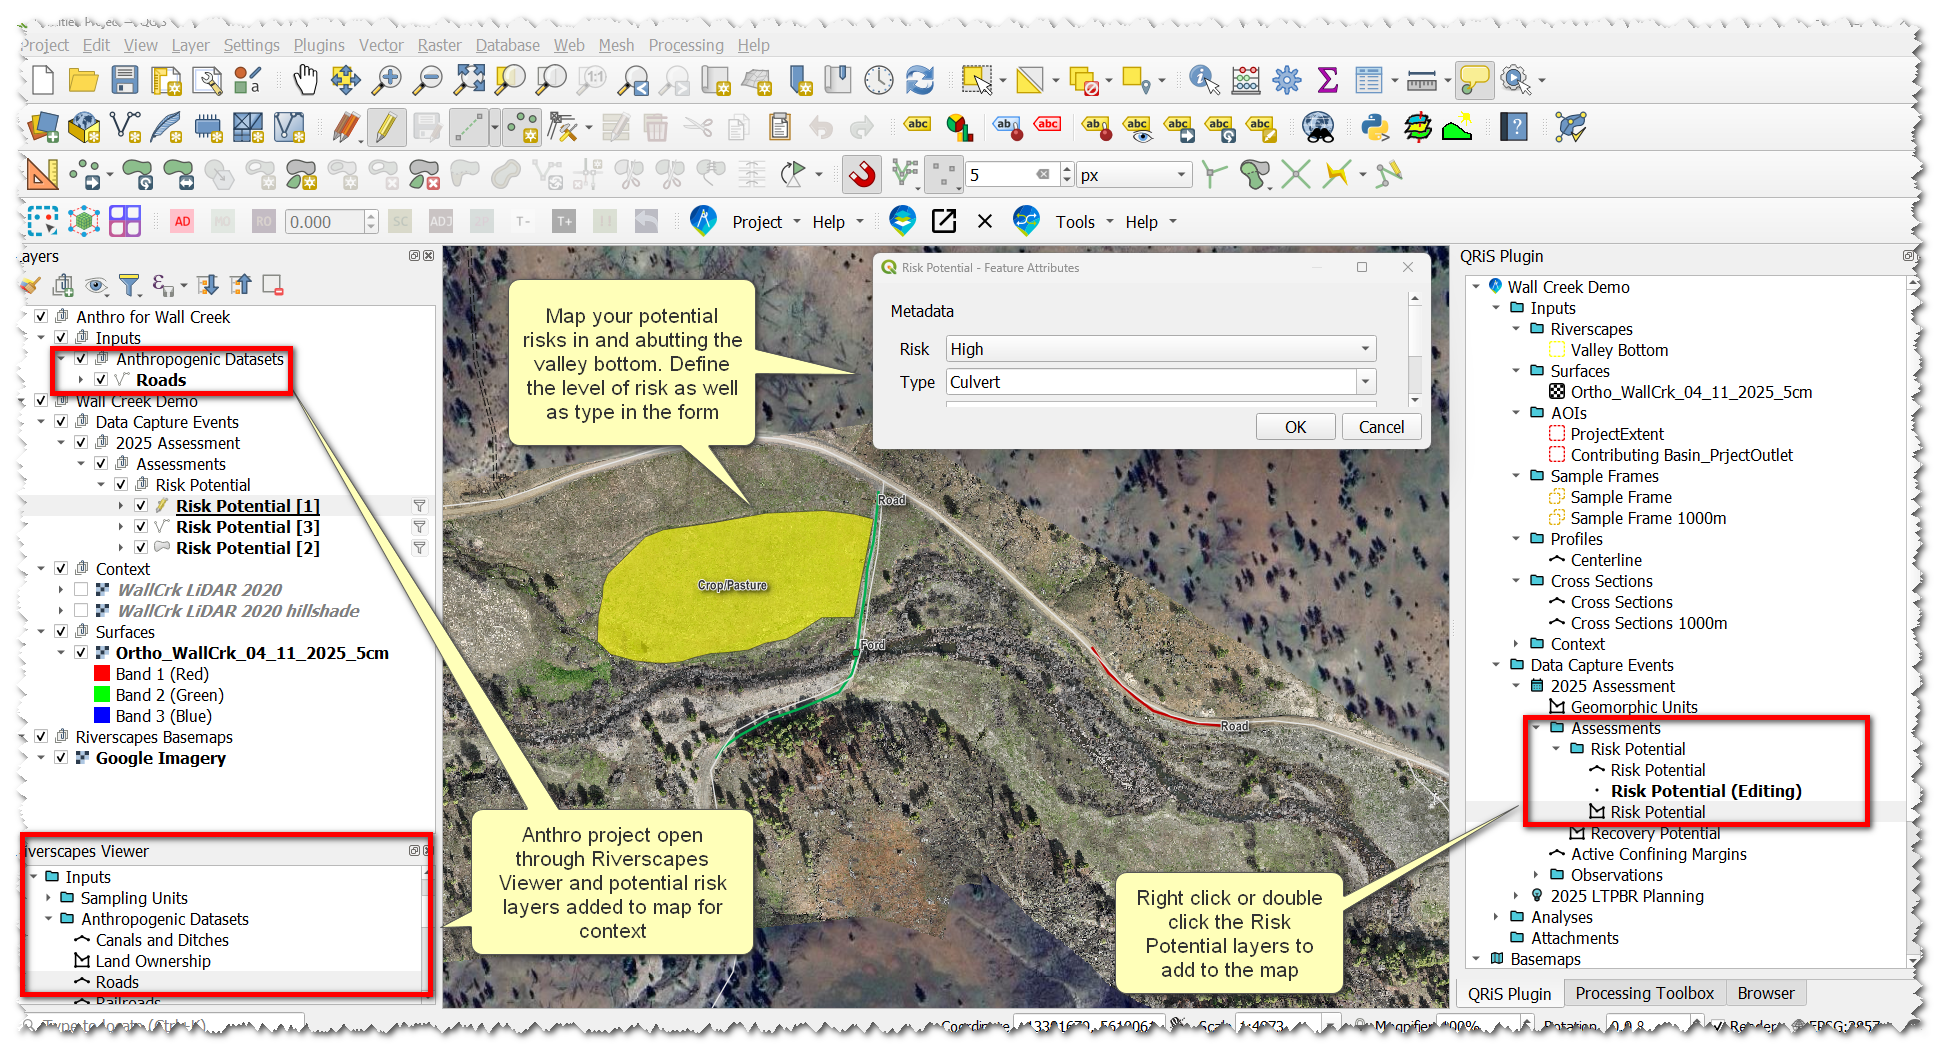
- Under LTPBR Protocol, add layers:
- Risk Potential (points, lines, polygons)
- Recovery Potential
- Name the DCE something useful, like 2025 Assessment
- In the Basic Properties tab, set the data of the DCE based on the date or date range of datasets used as your evidence layers (this may be difficult to do in our example since we are using basemaps)
- Under Surfaces, select your datasets that you plan to use as context for digitizing features
- In the Description tab, write a brief description of this DCE. A good description in this example would be, “This DCE represents the planning portion of this project. It is based on freely available datasets from the Riverscapes Data Exchange”
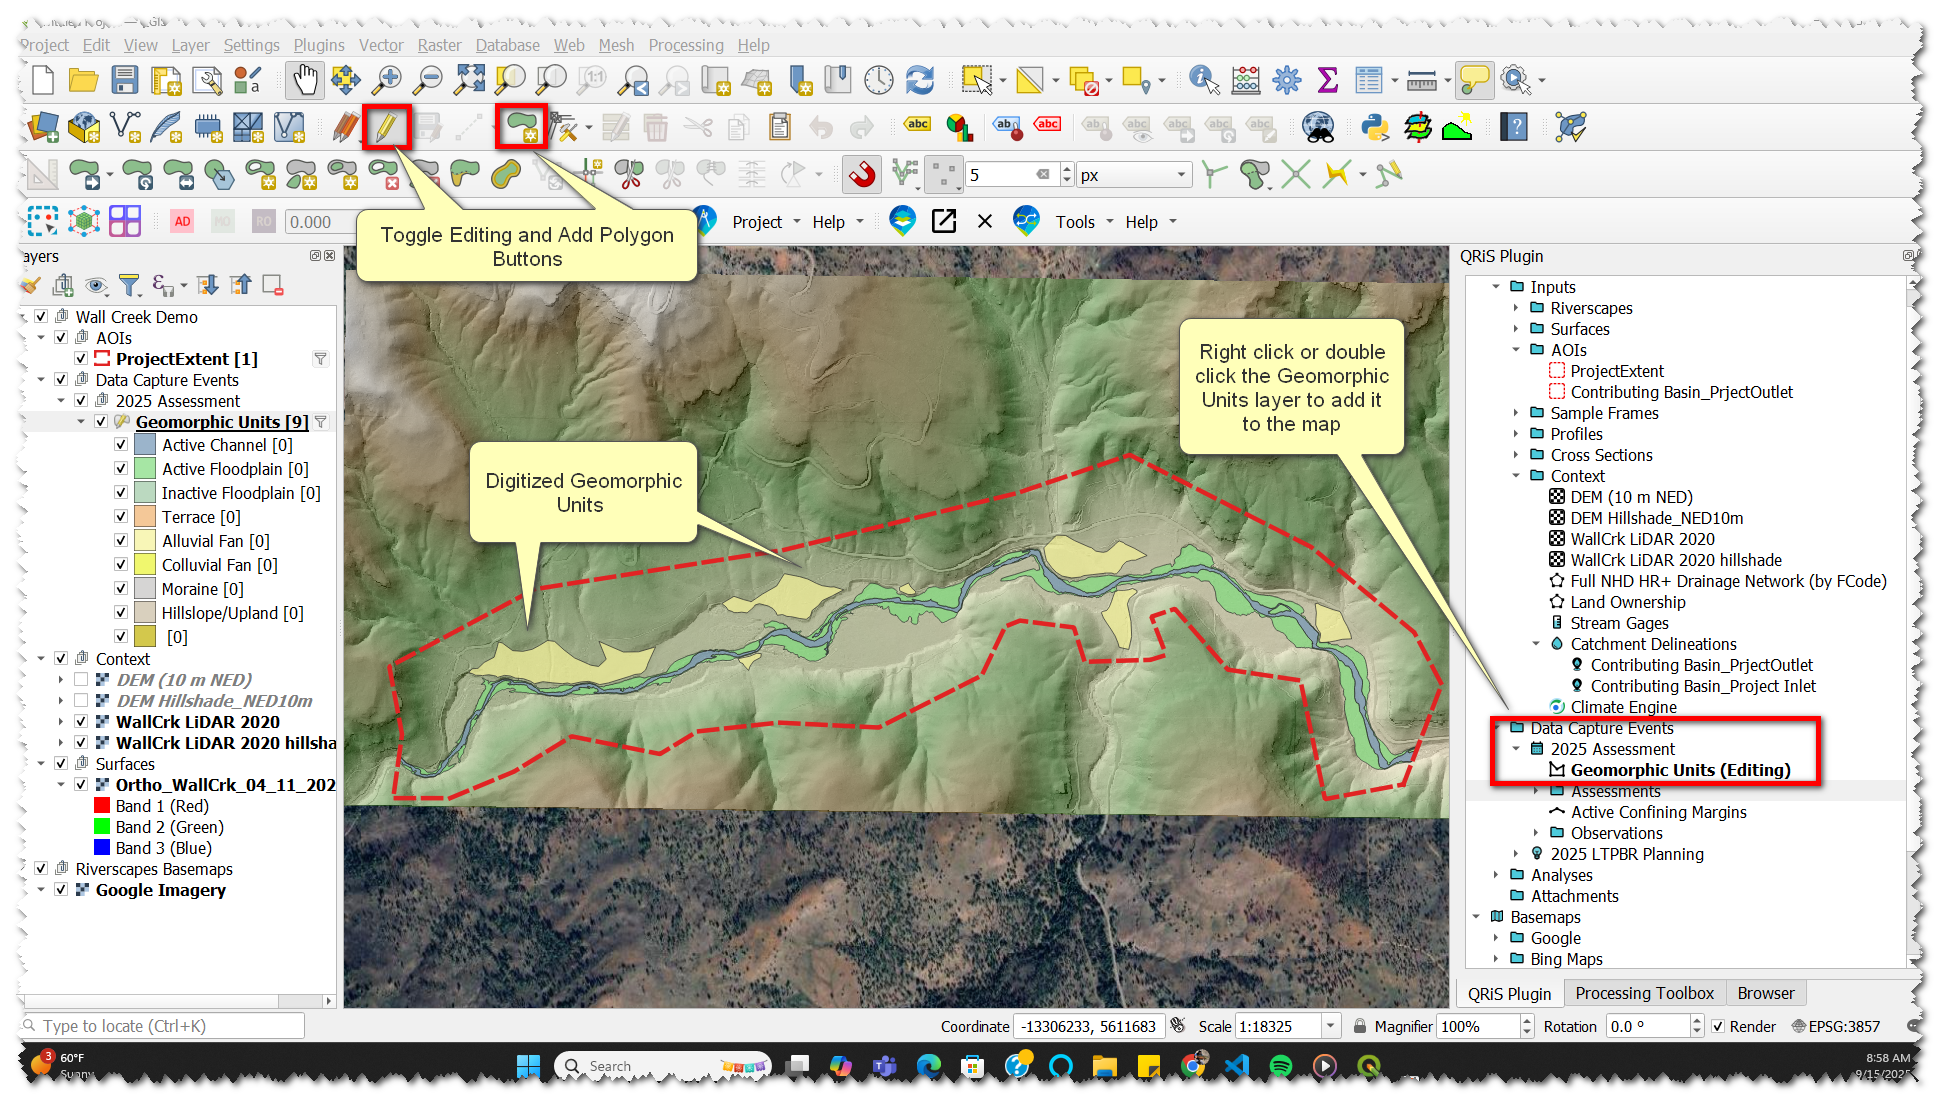
Map Geomorphic Units
- Add the Geomorphic Units layer to the map (either by double-clicking, or right-click -> add to map)
- With the Geomorphic Units layer selected, toggle editing.
- Click Add Polygon Feature. Using this tool, digitize terraces and fans, then digitize your active channel.
- Note: This is a great place to start using the Profile tool. The Profile Tool provides a better understanding of a landscape than visual identification, resulting in better mapping accuracy.
- Pull cross-sections from hillslope -> valley bottom -> hillslope to help verify valley bottom boundaries. Try it again across sections of the riverscape you suspect are hillslope transitioning to valley bottom to fan. This can help you draw your unit boundaries more accurately.
- Note: This is a great place to start using the Profile tool. The Profile Tool provides a better understanding of a landscape than visual identification, resulting in better mapping accuracy.
- Save edits by clicking the toggle editing button and save on the pop-up window
Map Valley Bottom and Compare to VBET
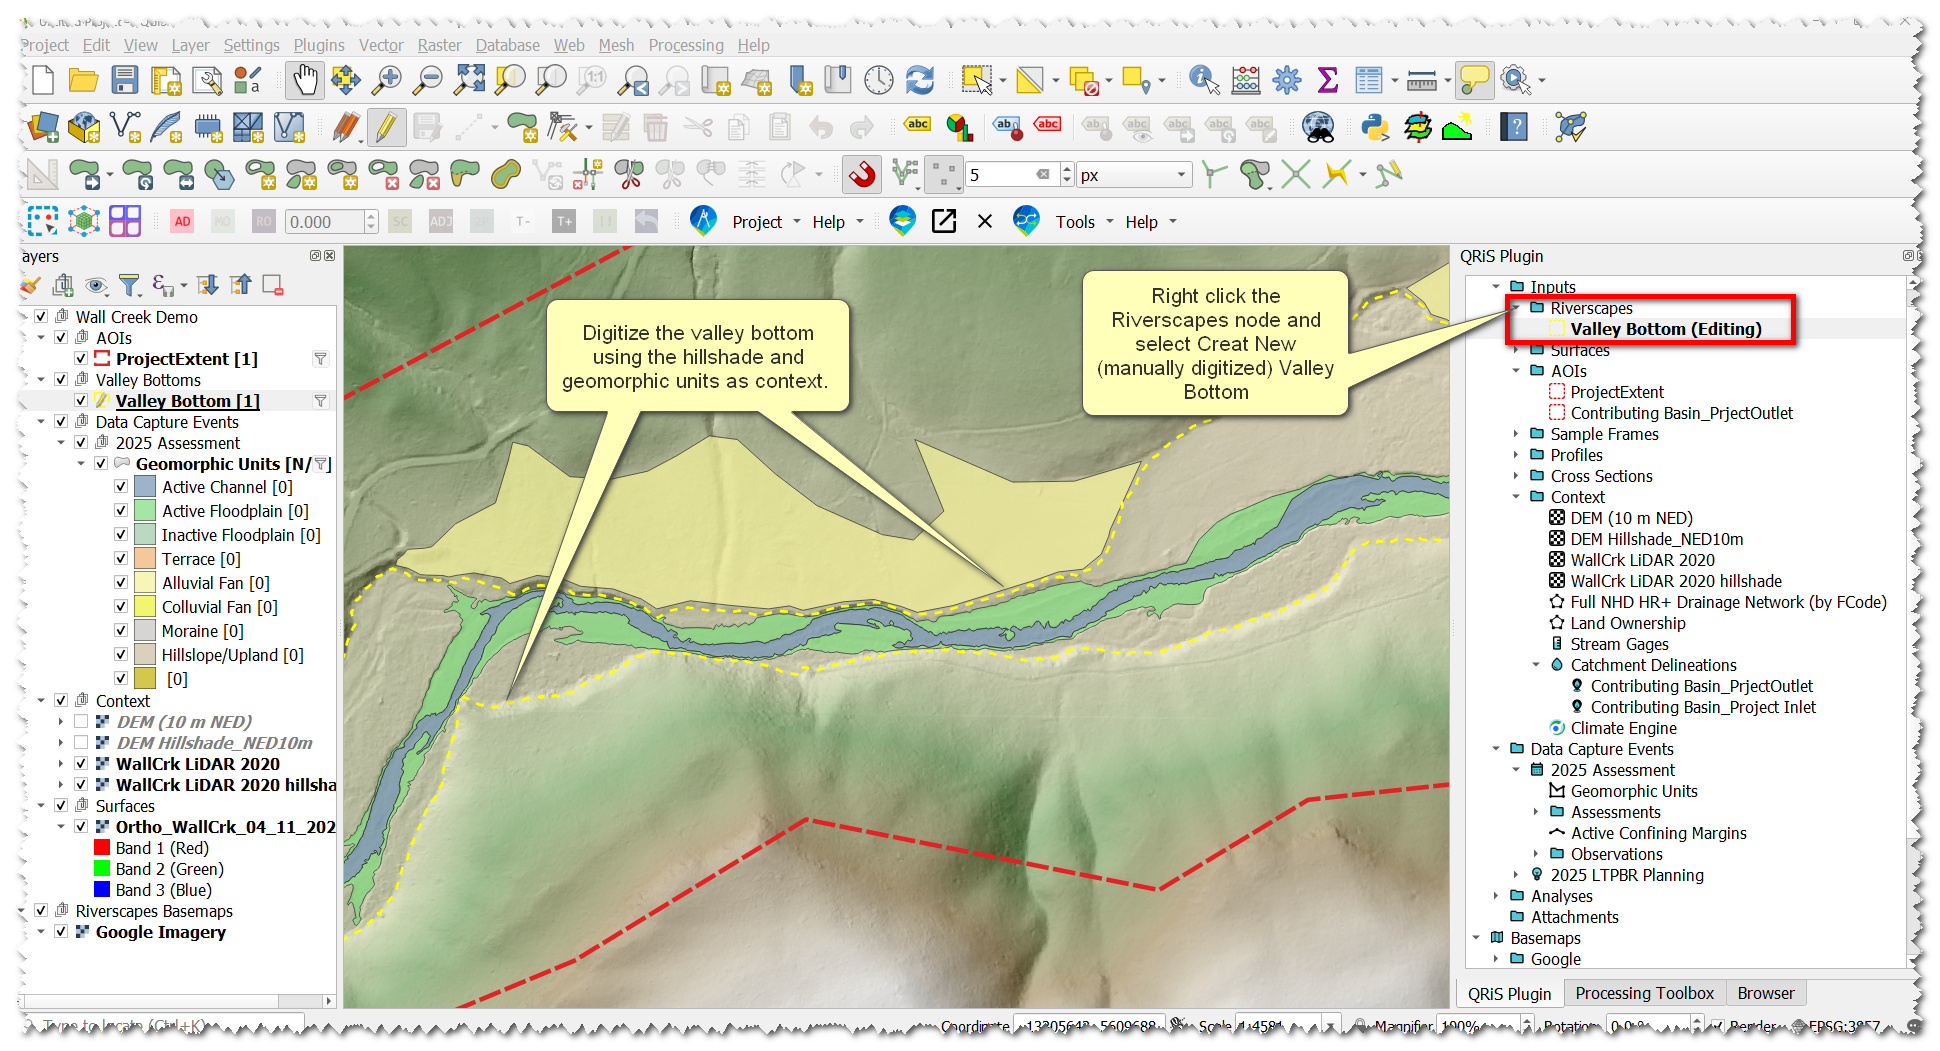
Manually Map the Valley Bottom
- Right-click Riverscapes node -> Create New (Manually Digitized) Valley Bottom. Name and describe the layer in the pop-up window.
- With the new valley bottom layer selected -> toggle editing.
- Click Add Polygon Feature.
- Digitize valley bottom polygons, informed by the hillshade and valley geomorphic units we just digitized. The valley bottom only (this layer) includes active channel and floodplain, and excludes fans and terraces.
- Save edits by clicking the toggle editing button and save on the pop-up window.
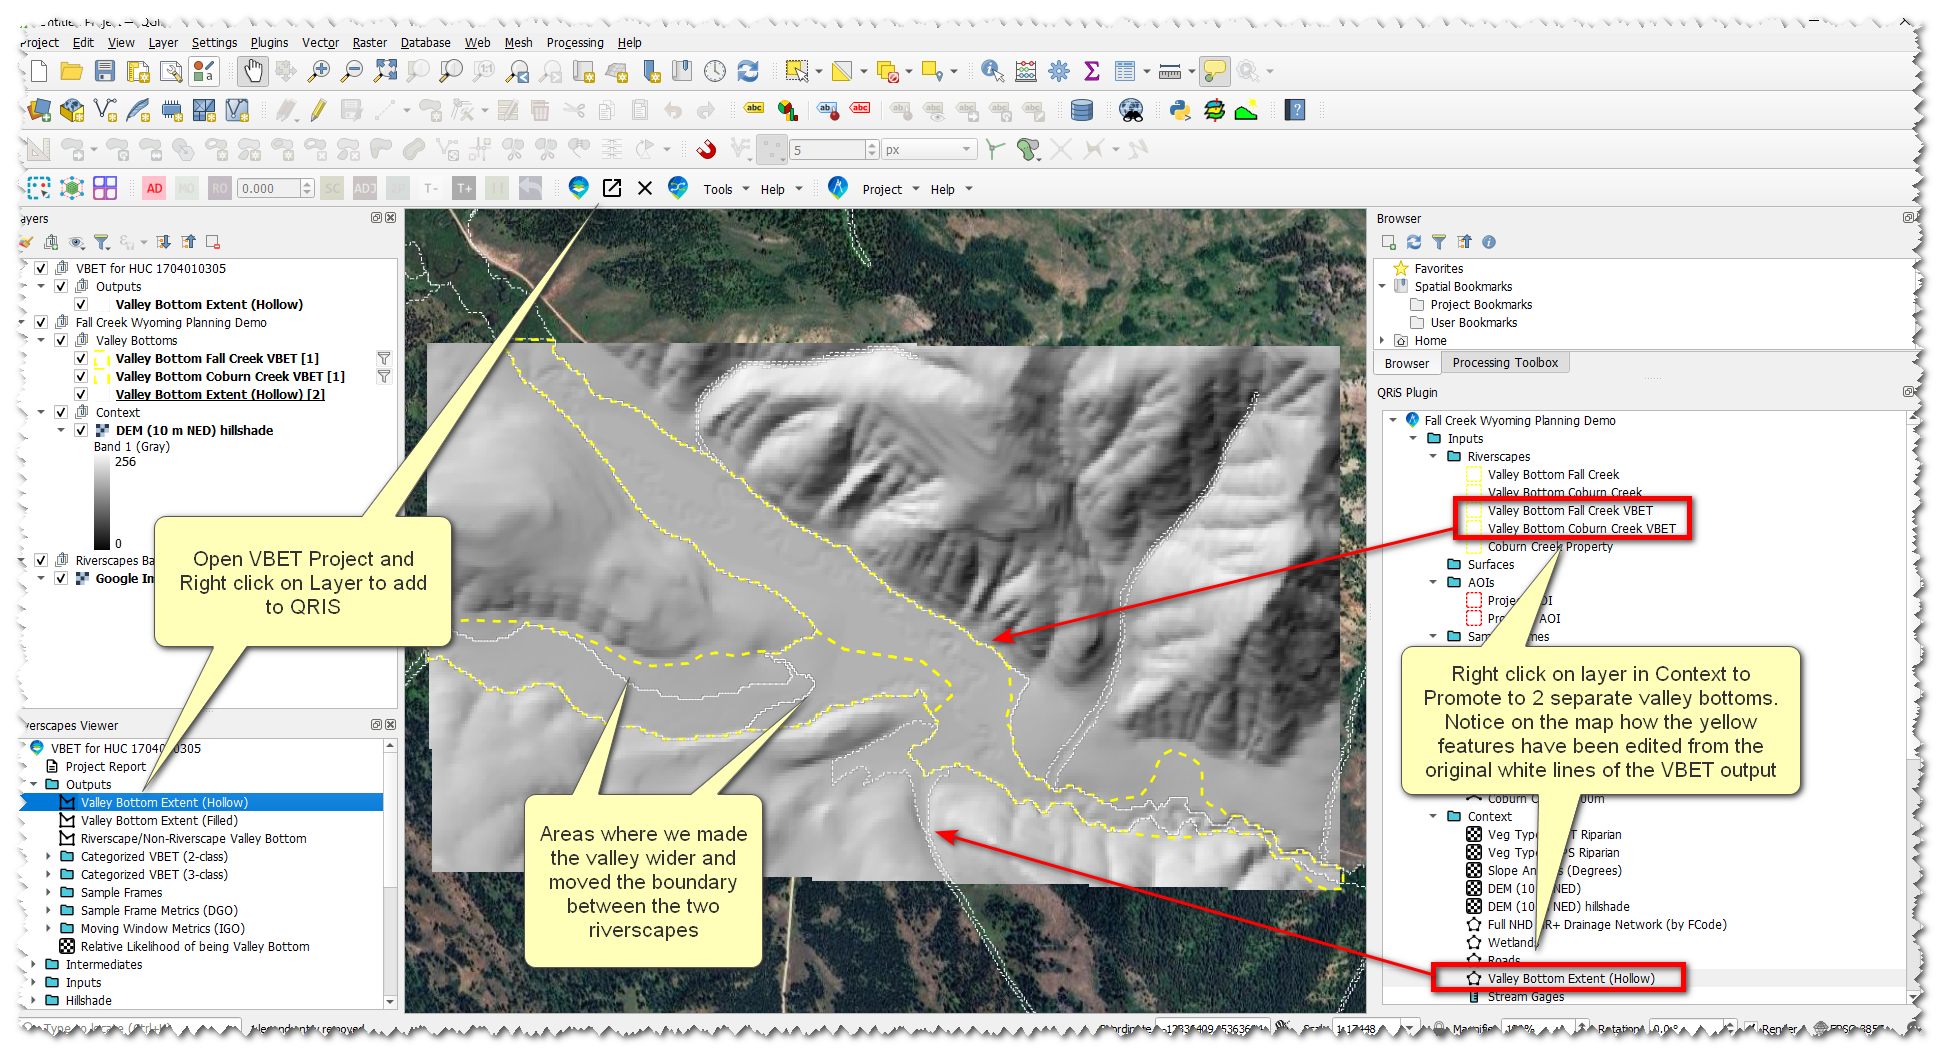
Open a VBET Project to Compare and Import into Project
- Open the VBET Riverscapes project that we downloaded earlier through the Riverscapes Viewer by browsing to and selecting the project.rs.xml
- Expand the Outputs folder -> Right click on "Valley Bottom Extent (Hollow)" and select 'Add to QRIS'
- In the pop-up window select the "Project AOI" from the 'Clip to AOI' dropdown menu, click ok to import the layer
- That layer will now appear in your project under the context node, we will now promote it to a Riverscape
- Right-click on the "Valley Bottom Extent (Hollow)" layer in Context -> Hover over 'Promote to...' and select "Riverscape Valley Bottom"
- Rename the valley bottom to Something like "Fall Creek Valley Bottom VBET" to indicate that this valley bottom is from VBET and its for the riverscape of Fall Creek
- Repeat steps i. and ii. but this time change the name to "Coburn Creek Valley Bottom VBET"
- Individually edit each of the 2 new riverscapes to achieve a few different things
- Make sure there is one feature for each of the two riverscapes, you will need to delete extra features that dont correspond to the riverscape
- Edit the valley bottom extent to include or exclude places you think the VBET output is wrong (if necessary)
- Edit the valley bottoms to join in the correct location (sometimes vbet over exaggerates the mainstem valley bottom up the tributaries)
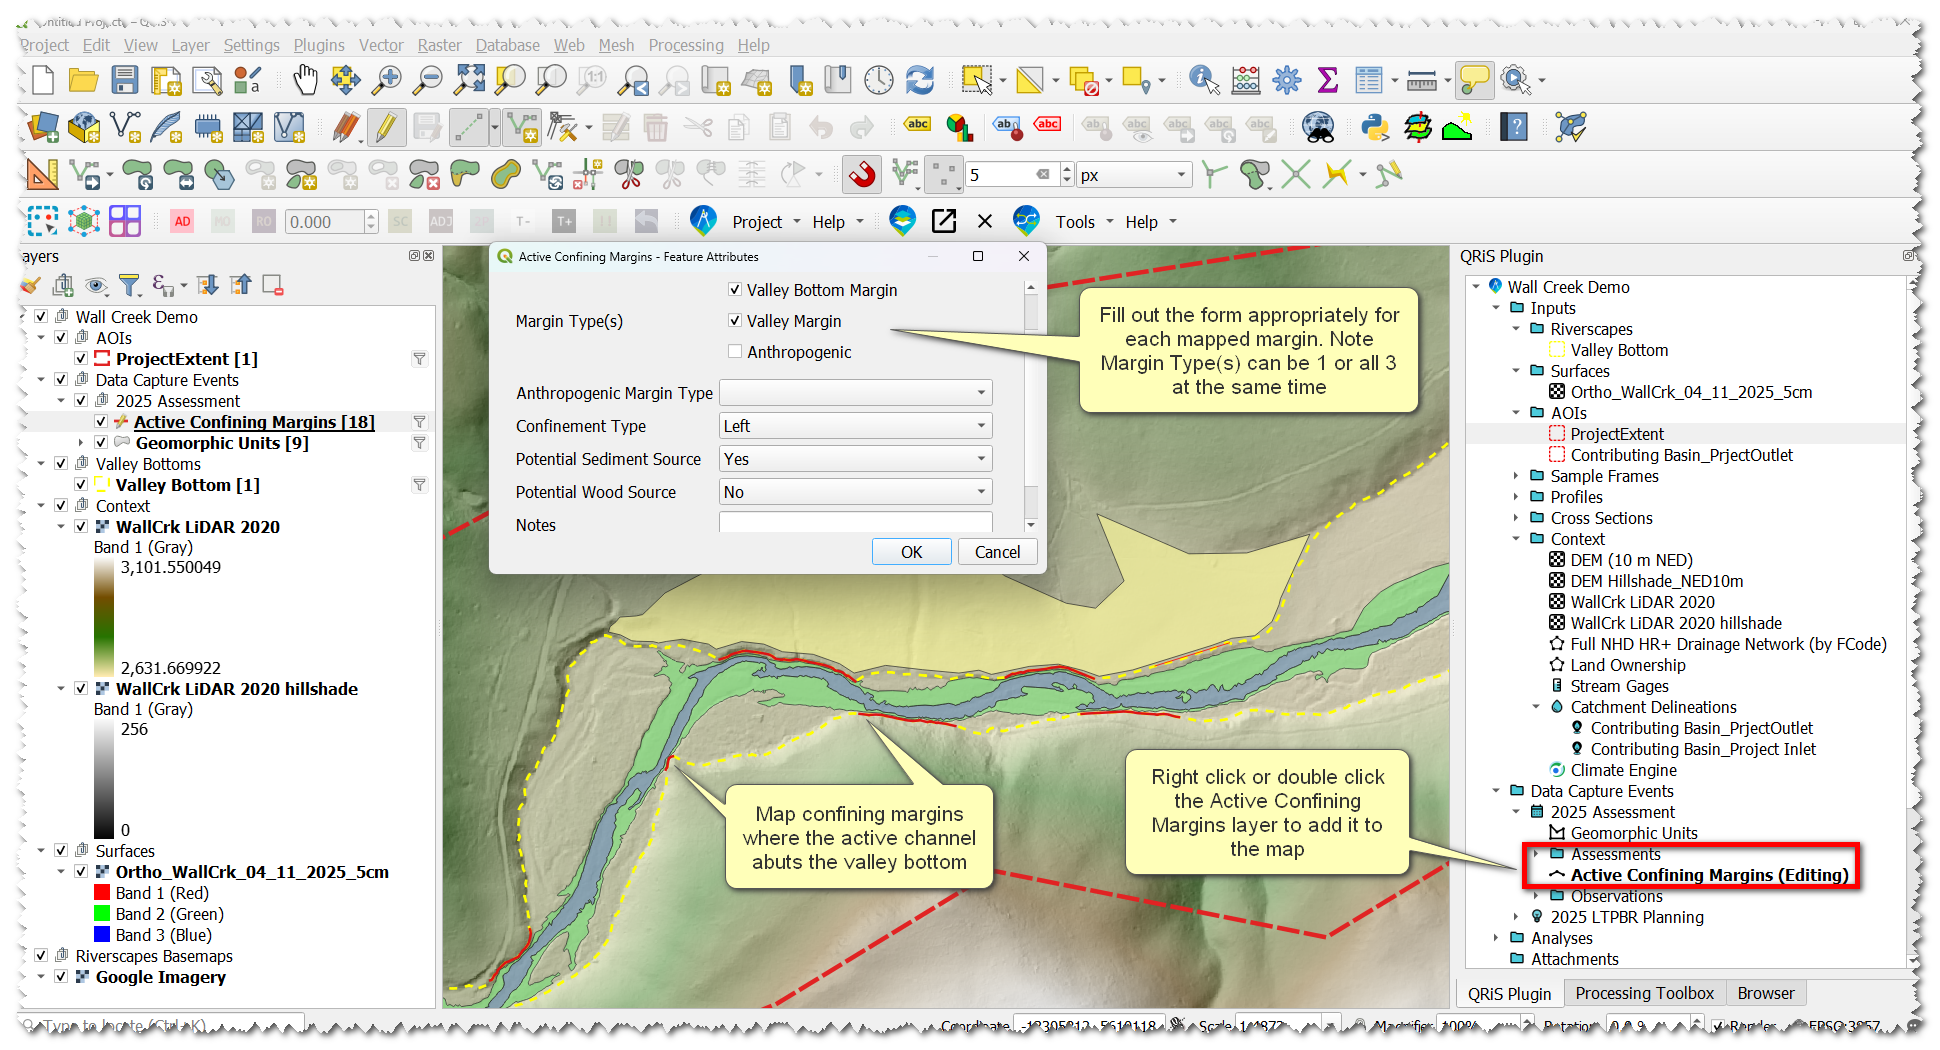
Map Active Confining Margins
- In your DCE -> Active Confining Margins layer -> double-click or right-click -> add to map
- With the Active Confining Margins layer selected, toggle editing.
- Digitize places where the channel abuts a confining margin. Select the appropriate attributes associated with each mapped margin
- Save edits by clicking the toggle editing button and save on the pop-up window.
Map Risk
- Open the Anthro Riverscapes project that we downloaded earlier through the Riverscapes Viewer by browsing to and selecting the project.rs.xml
- In the Riverscapes Viewer panel, add potential risk layers to the map (layers such as roads, canals, land ownership, etc). We’ll use these as the basis for delineating your risk layers next.
- Add one of your QRIS risk layers to the map and toggle editing. There are three different Risk Potential layers: points, lines, and polygons. Digitize these as:
- Polygons: risk you may need to create a boundary on, like a building or pasture
- Lines: roads, canals, etc
- Points: culverts, bridges, etc
- Assign risk attributes for features including type and severity
- Repeat on each layer individually as necessary.
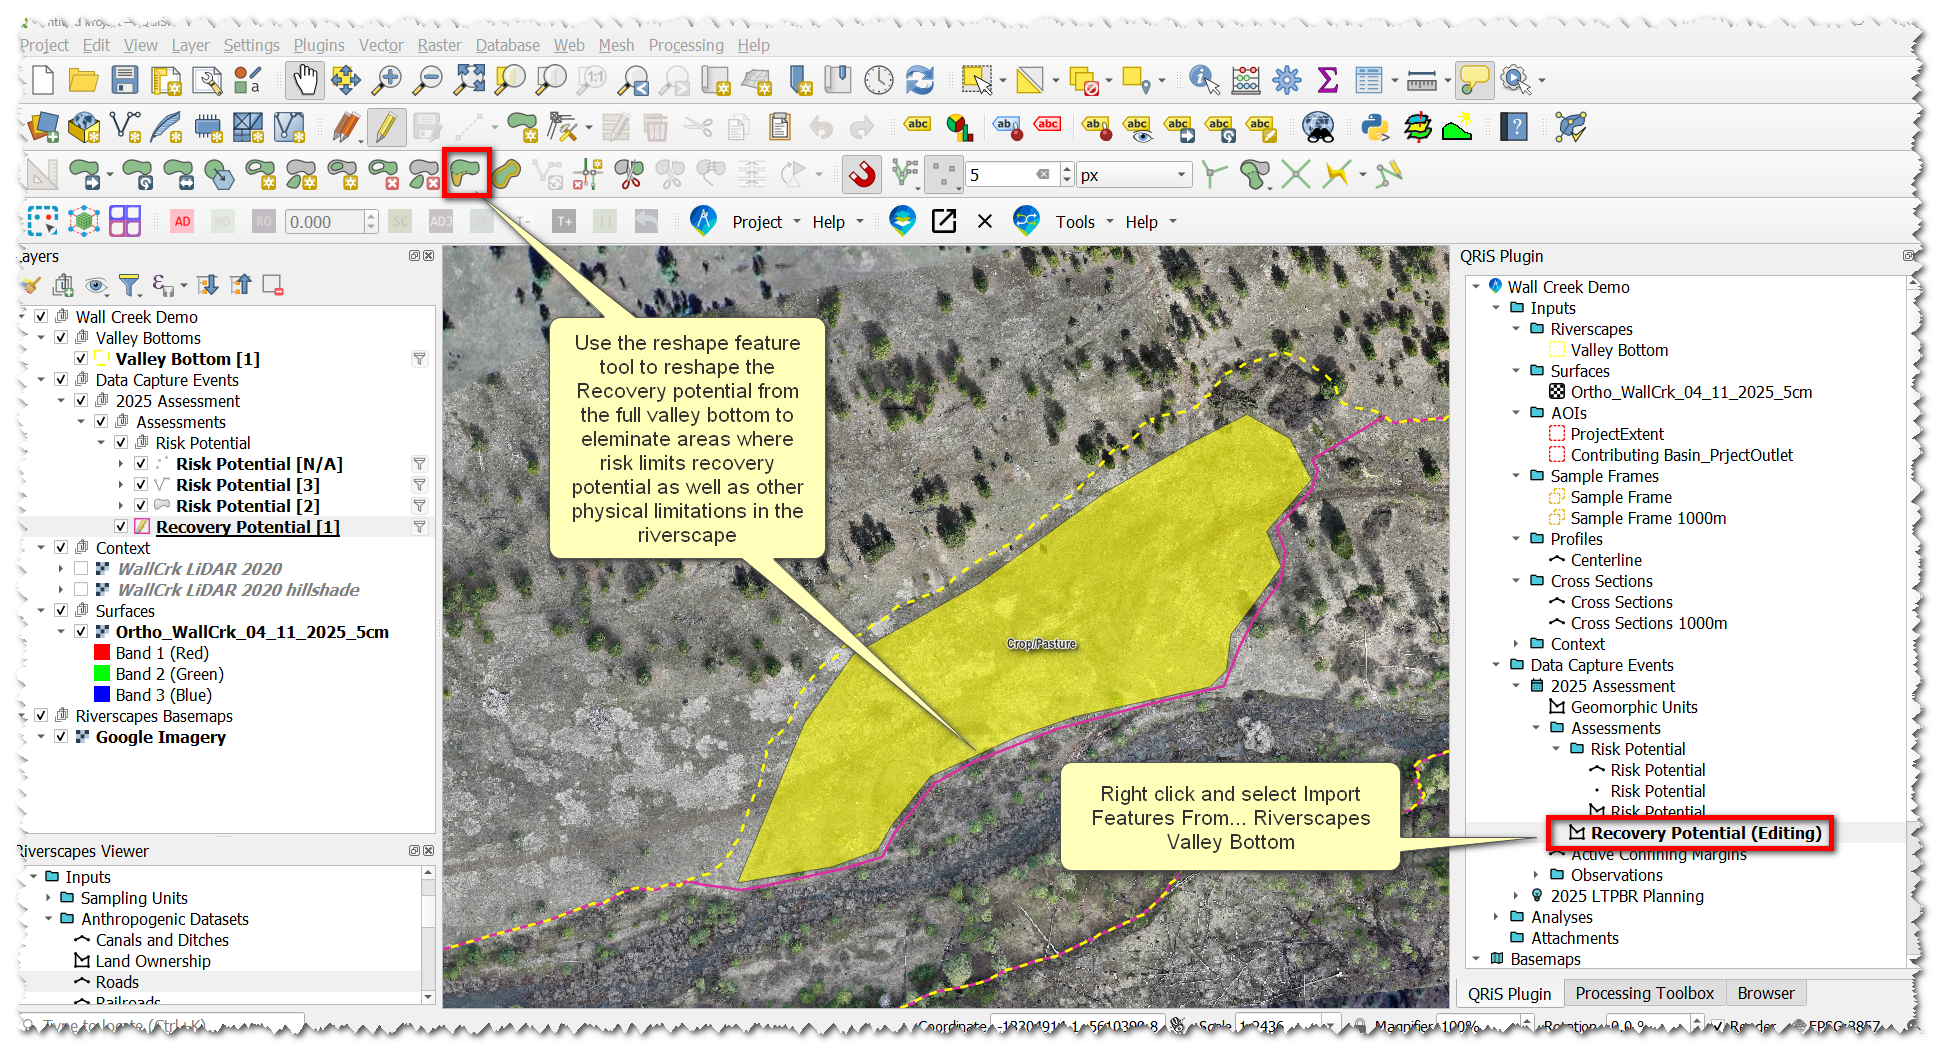
Map Recovery Potential
The riverscape valley bottom is the baseline for recovery potential, so we’ll start with that previously-digitized information. This step will duplicate the Valley Bottom geometry into the Recovery Potential layer where we can make necessary edits without having to start from scratch.
- Right-click on the Recovery Potential layer -> Import Features from Riverscapes Valley Bottom
- Toggle editing on the layer. Use the Reshape Features digitizing tool to make edits where necessary.
- You will have to do this twice for your two different VBET riverscapes we created earlier.
Here, we can look at the risk layers we digitized and determine what we can actually recover in the riverscape. Consider what portions of the active floodplain are recoverable, versus parts separated by a berm, levee, or other limiting factor not involved in risk mapping.
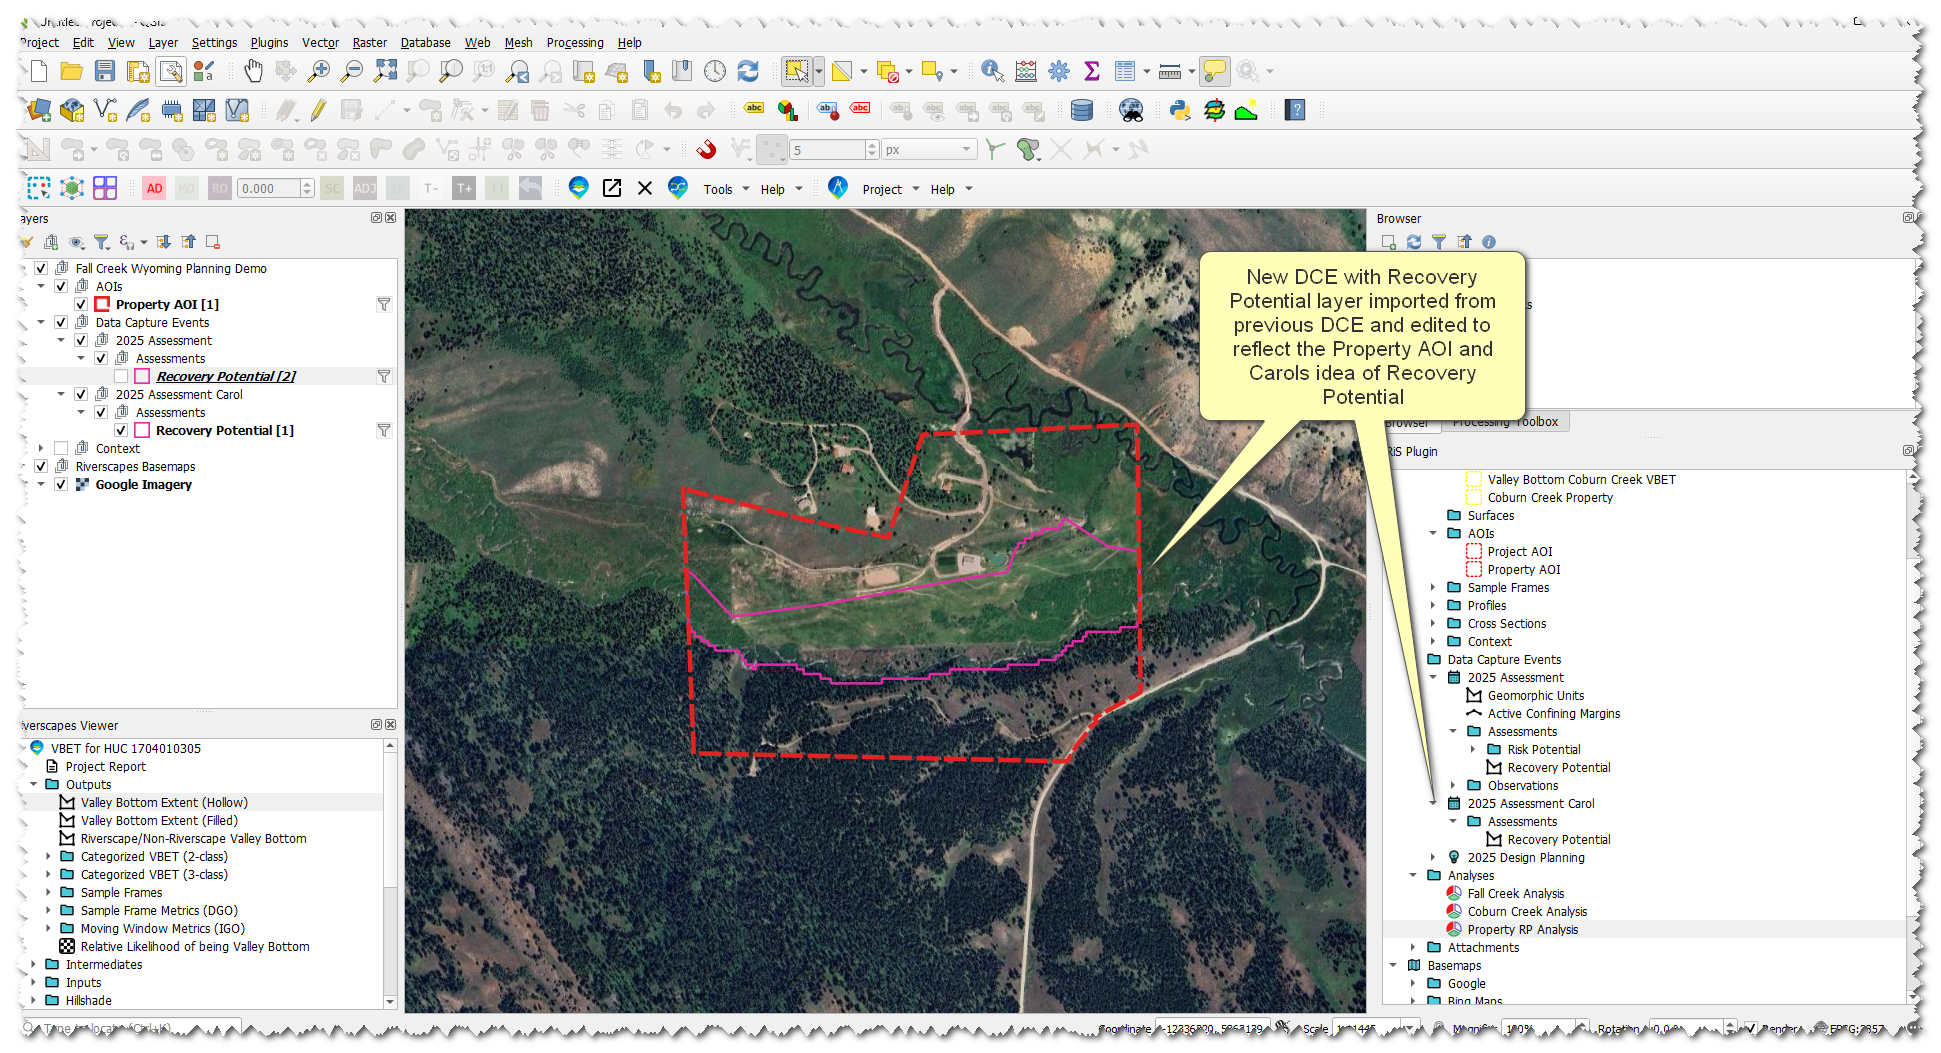
Carol vs Pops, Differing Ideas on Recovery Potential
In Our Module 4 example Carol and Pops have differing ideas on what recovery potential should look like. If we compare what we digitized it matches pops, so we need a way to create another recovery potential for Carol to compare against.
- Create a New DCE and call it "2025 Assessment Carol"
- Follow the same steps we did earlier for creating a DCE but only select the Recovery Potential layer from the LTPBR Procotol
- Rather than digitizing a new layer we can import from a previous DCE. Right-click the Recovery Potential layer in the new DCE and select "+ Copy from Data Capture Event" -> Select the appropriate DCE.
- Add that layer to the map and toggle editing
- Delete the feature that corresponds to the Fall Creek Riverscape and edit the remaining feature to the extents that Carol drew as well as to the Property AOI
- Saved edits
We now have 2 DCEs with different Recovery Potential layers that we can compare in Analyses. However, we need a corresponding Sample Frame for that Analysis. This will be addressed when we generate sampe frames.
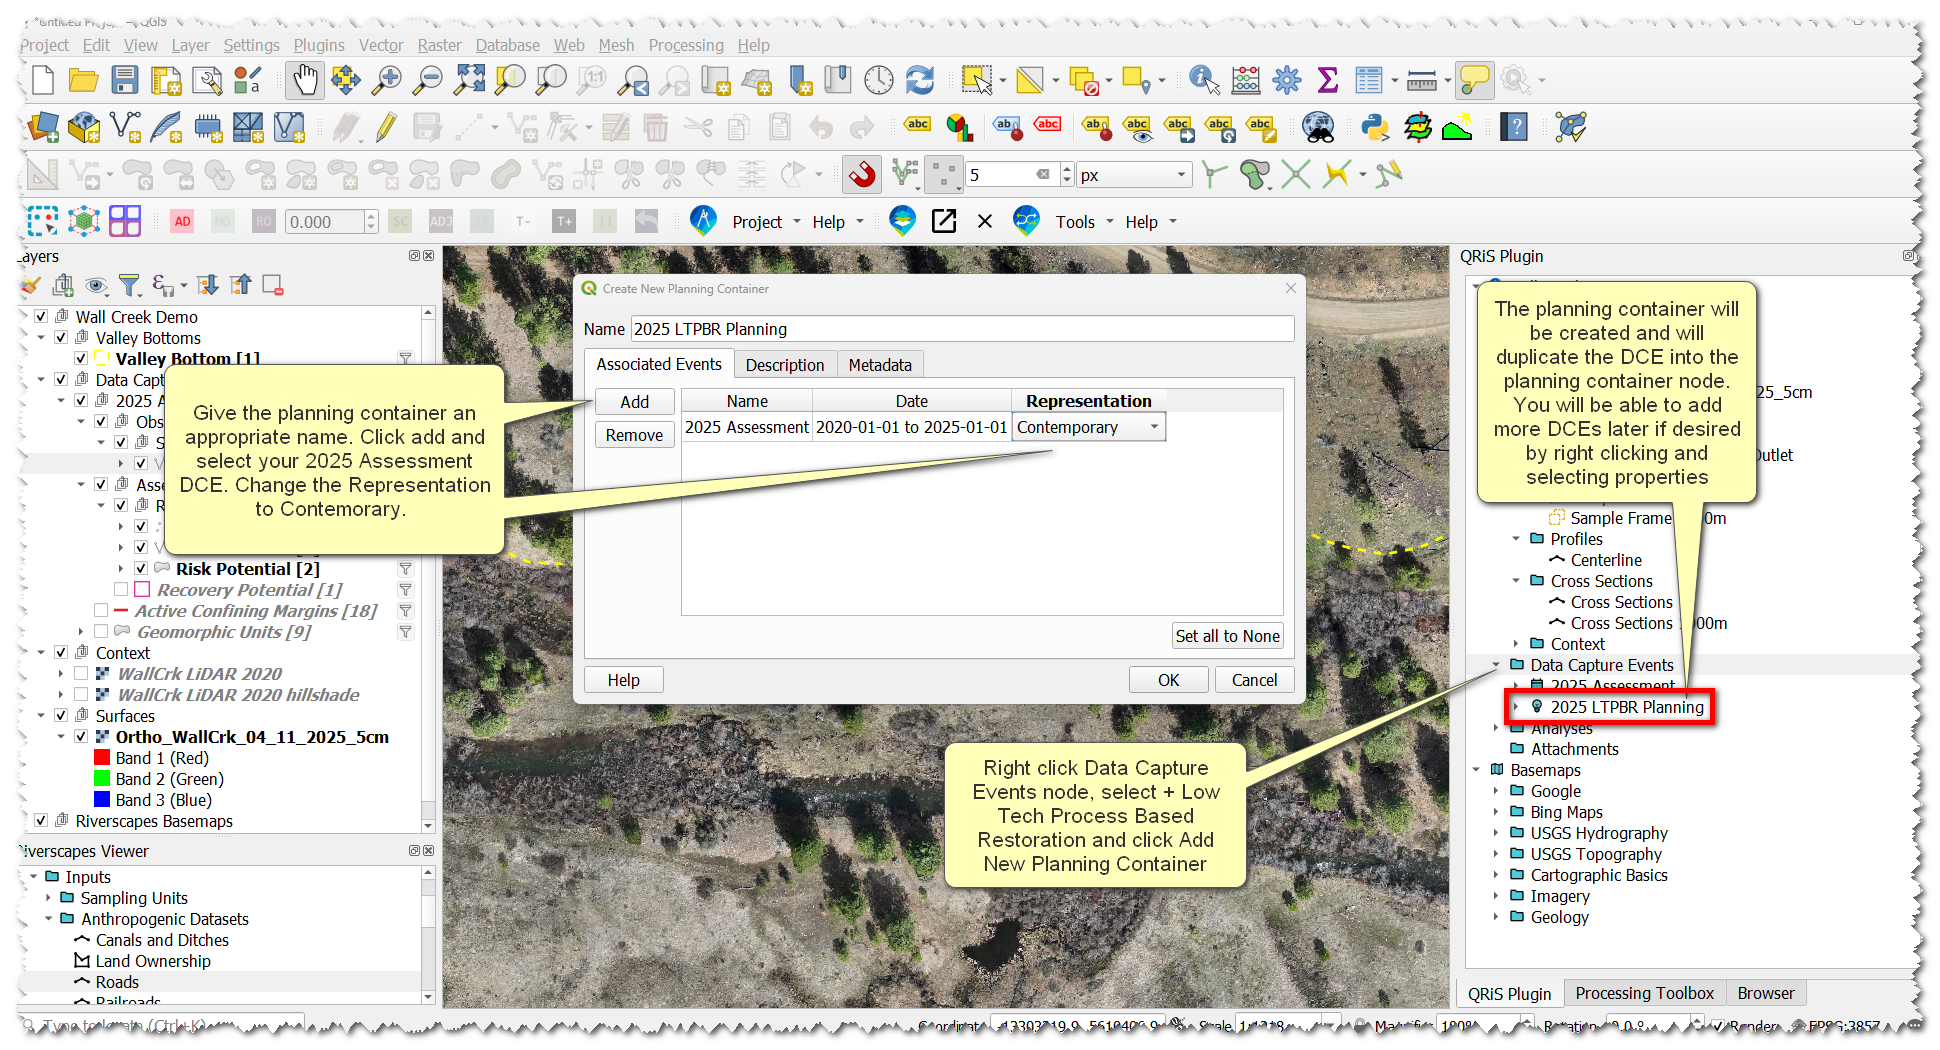
Create a Planning Container
- Right-click Data Capture Events Folder -> +Low Tech Process Based Restoration -> Add New Planning Container
- In the pop-up, name it something useful, like 2025 LTPBR Planning. Click add -> select 2025 Assessment DCE. It will now populate the table. Change its representation to Contemporary.
Ideally, a planning container would also have both a Historic and Predicted DCE. A planning container simply copies DCEs into a new parent folder, which you’ll reference as the basis for LTPBR Design, when we get there.
Generating Sample Frames
Sample Frames are what QRIS uses to calcualte metrics(i.e. zonal statistics) within as part of analyses. Sample Frames can be any polygon, but here we’ll consider two specific ways QRIS supports to create sample frames of riverscapes: i) using derived cross sections and ii) manually digitized cross sections (or reach breaks). If you want standardized reach lengths use derived cross sections. If you want to be in control of reach breaks then manually digitize cross sections. You may want to do this if there is a change in land ownership or a change in riverscape characteristics.
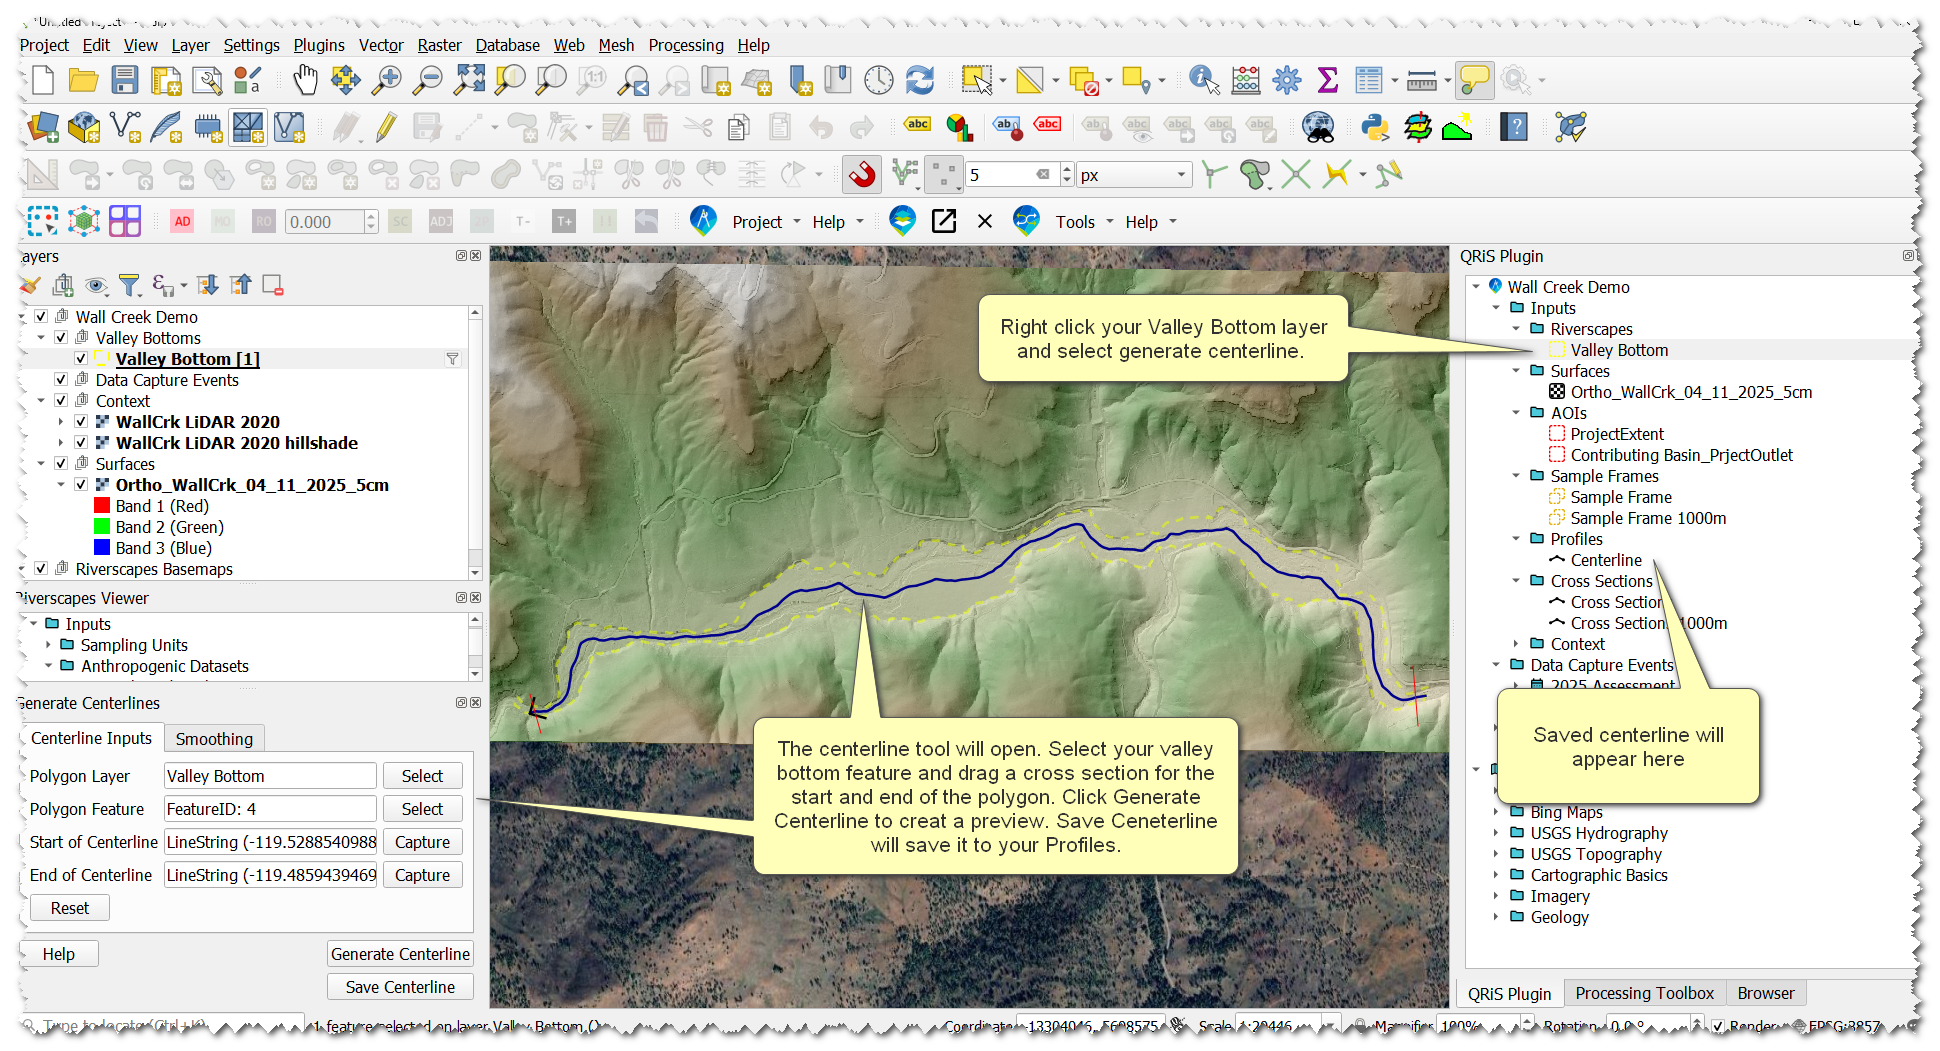
- Right-click one of the Valley Bottom VBET layers -> Generate Centerline
- Use the centerline tool to create and save a centerline to your project
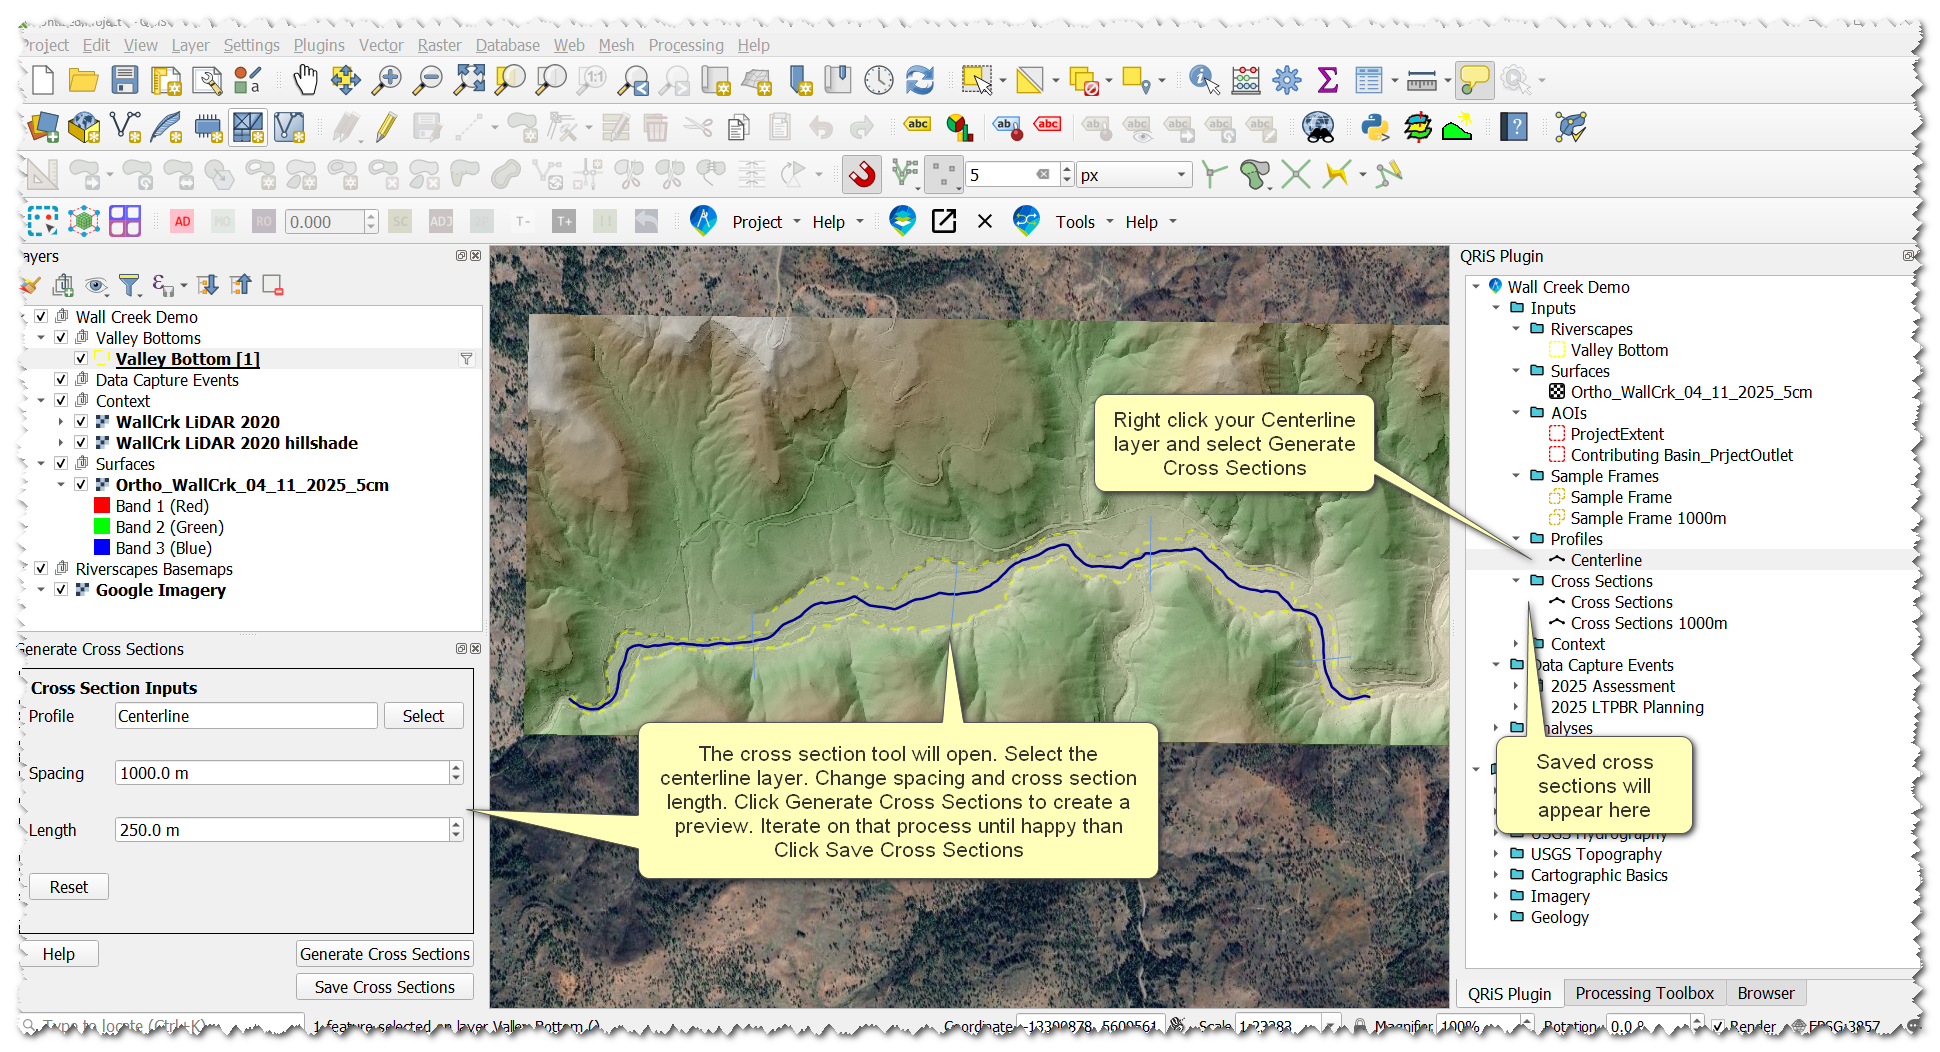
- Right-click the Centerline layer -> Generate Cross Sections
- Use the cross section tool to create and save cross sections to your project
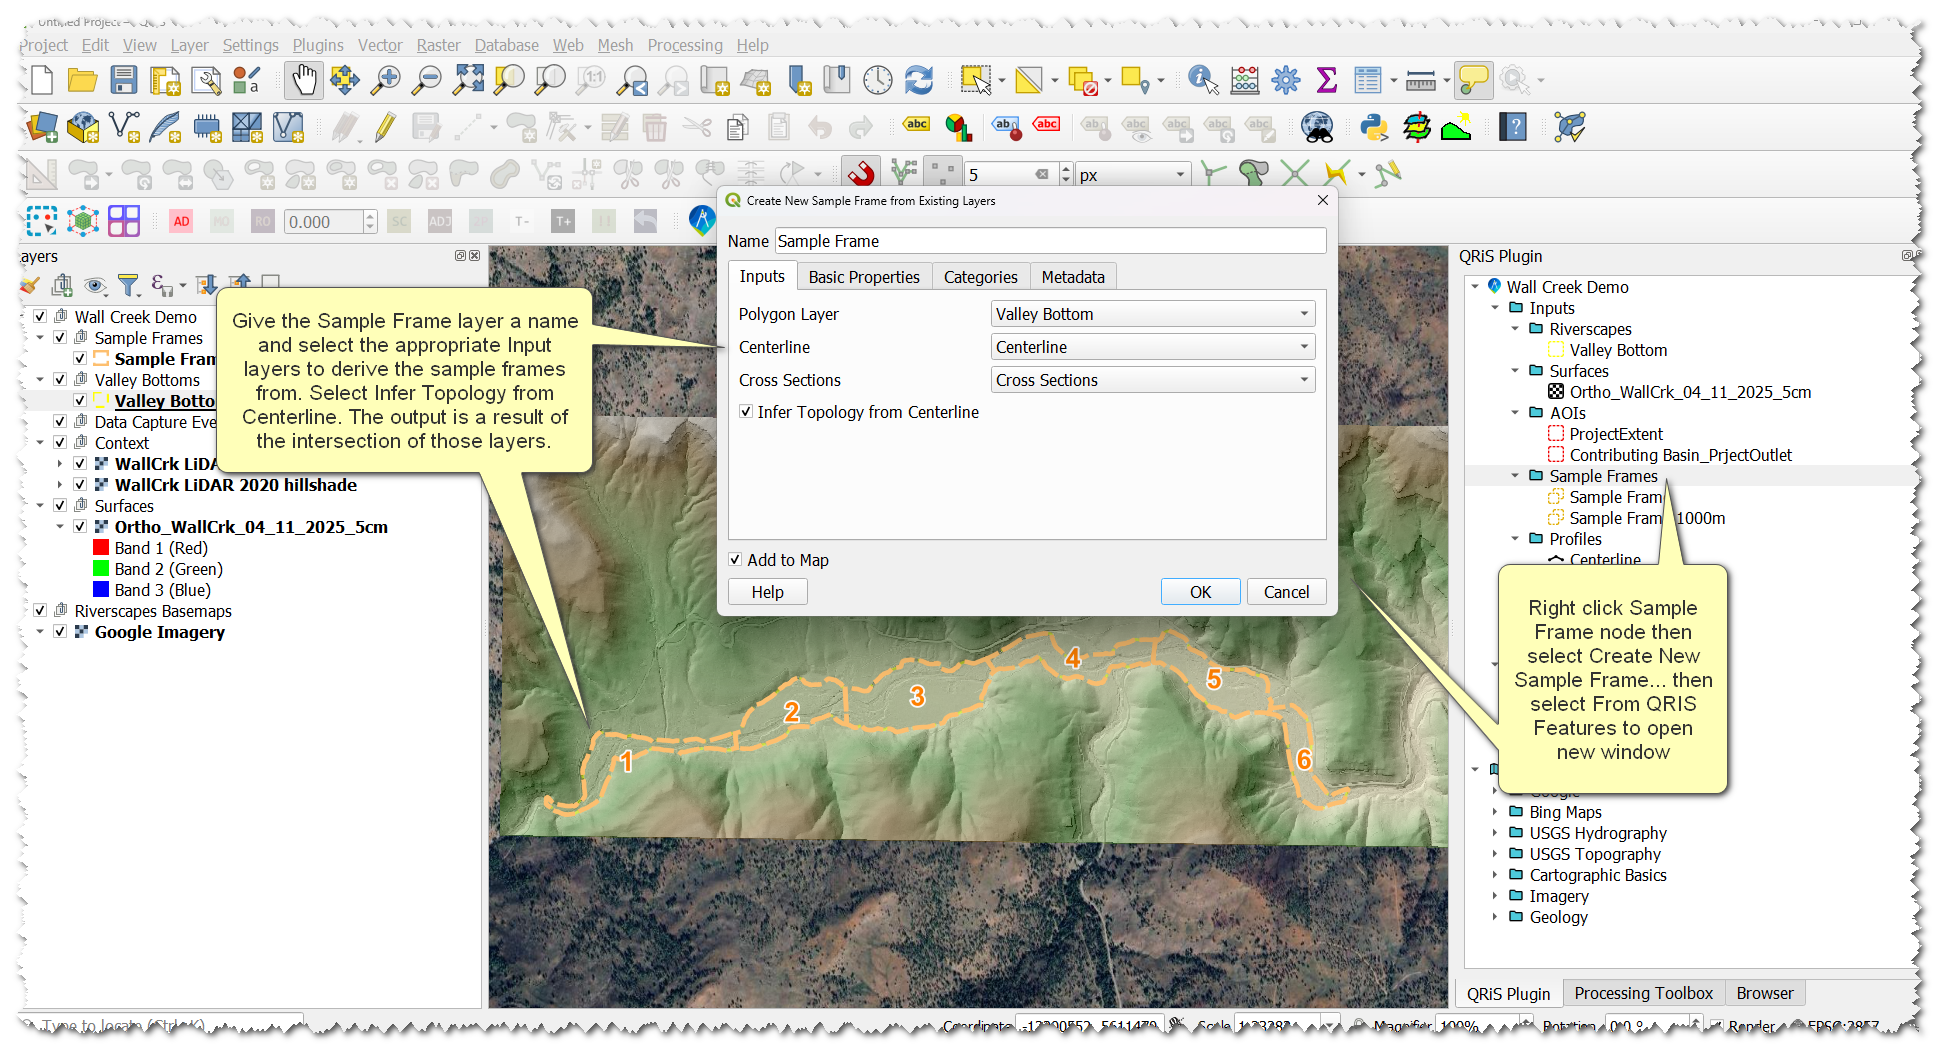
- Now, we have the building blocks to create a sample frame. Right-click the Sample Frames folder -> Create New Sample Frame -> From QRiS Features
- In the pop-up window, select the input layers to build a sample frame from(this will autopopulate with the layers you just created). Give it a helpful name. Check Infer Topology from Centerline.
- Do this for both of your VBET riverscape layers
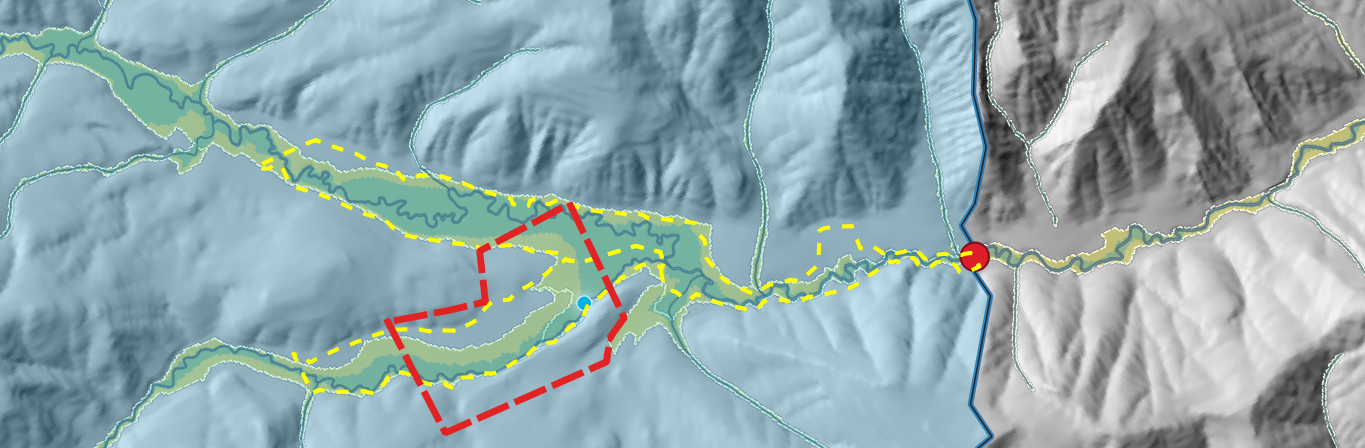
Create a Sample Frame to Compare Carol and Pops Recovery Potential
There are different ways to do this but the easiest uses a tool outside of QRIS to create a temporary layer to then import into the project
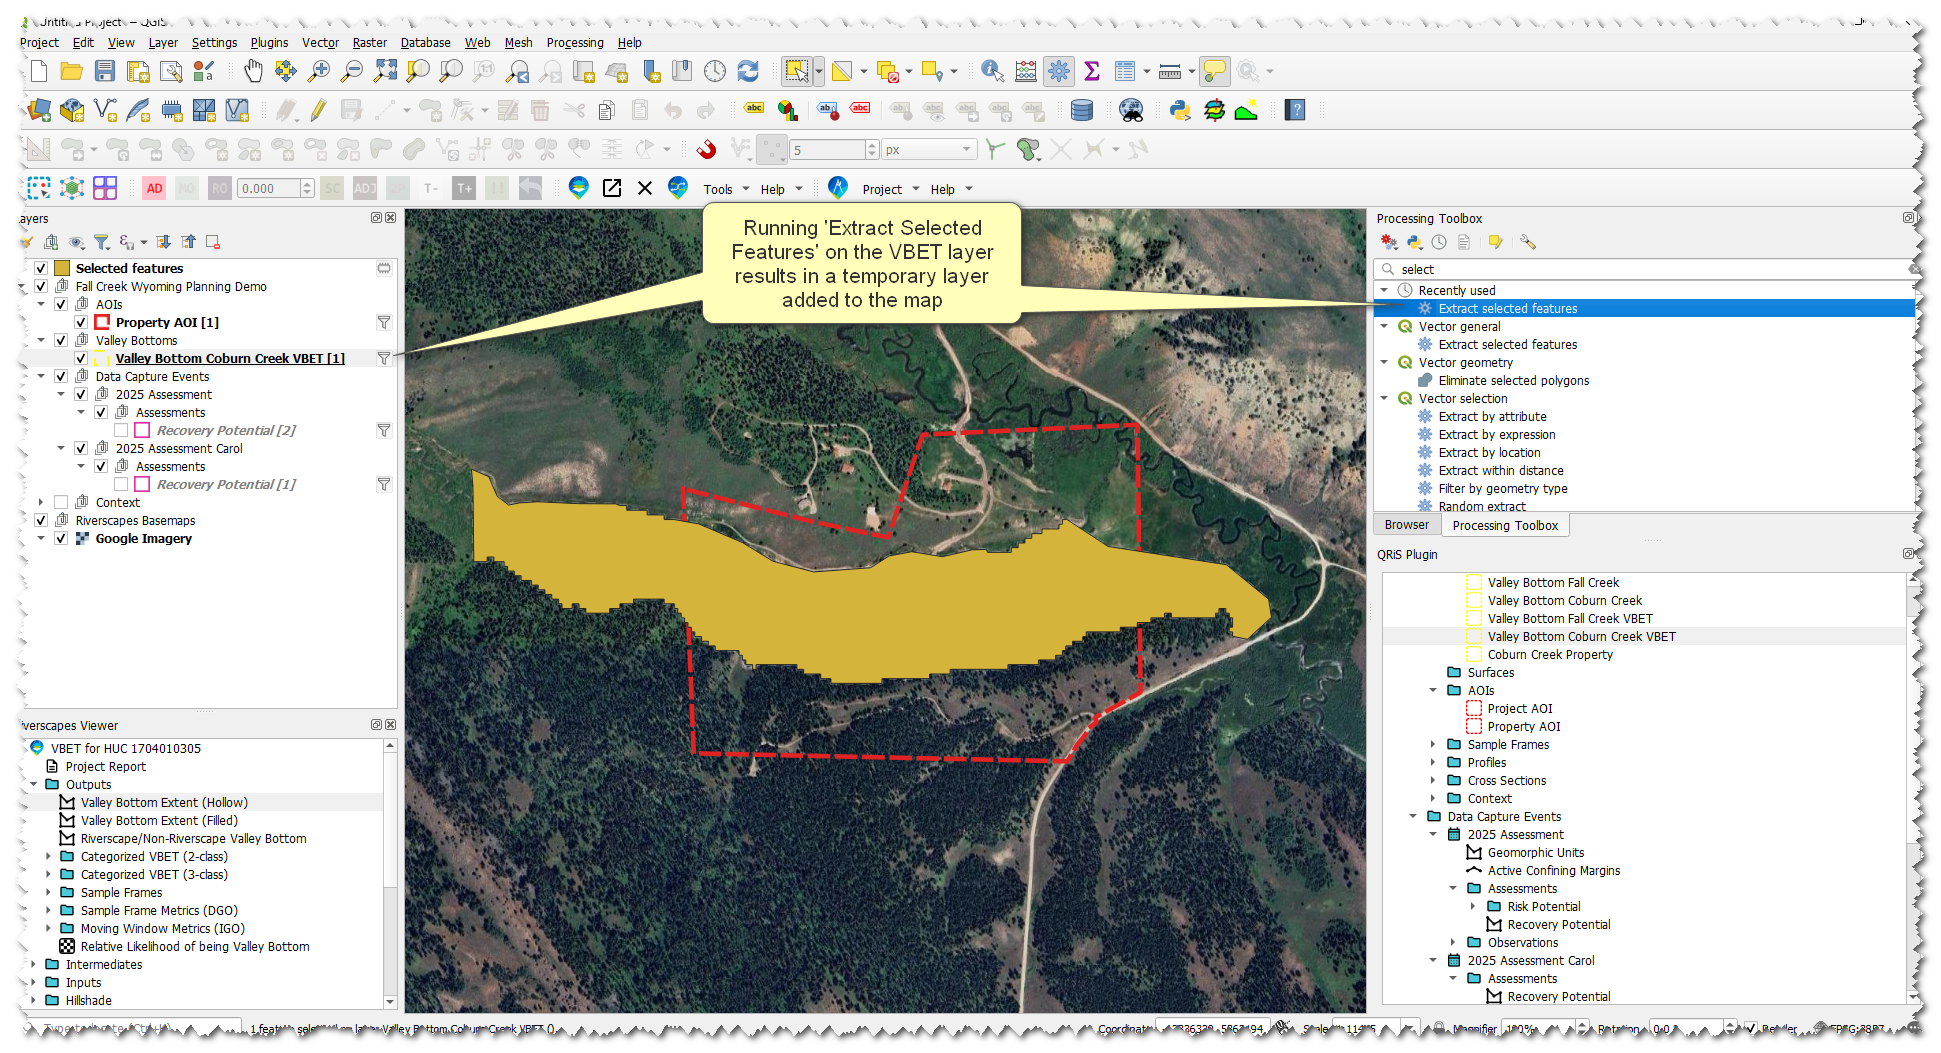
- Add your Coburn Creek Valley Bottom VBET layer to the map -> use the selection tool to select the feature -> search the processing toolbox for 'Select Extracted Features' tool.
- Make sure the correct layer is selected in the tool and click run (no need to save to a location, we just want a temporary layer)
- Right-click the Sample Frames node -> Import Sample Frame from... -> select "Layer in Map"
- Choose the Temporary Layer in the dropdown, Give it a name like "SF Property", and select the "Property AOI" in the 'Clip to AOI' dropdown
- Leave all other fields as none and click ok
Analyses
Now that we have created sample frames we can use those to create an analysis and calculate metric values derived from features we digitized.
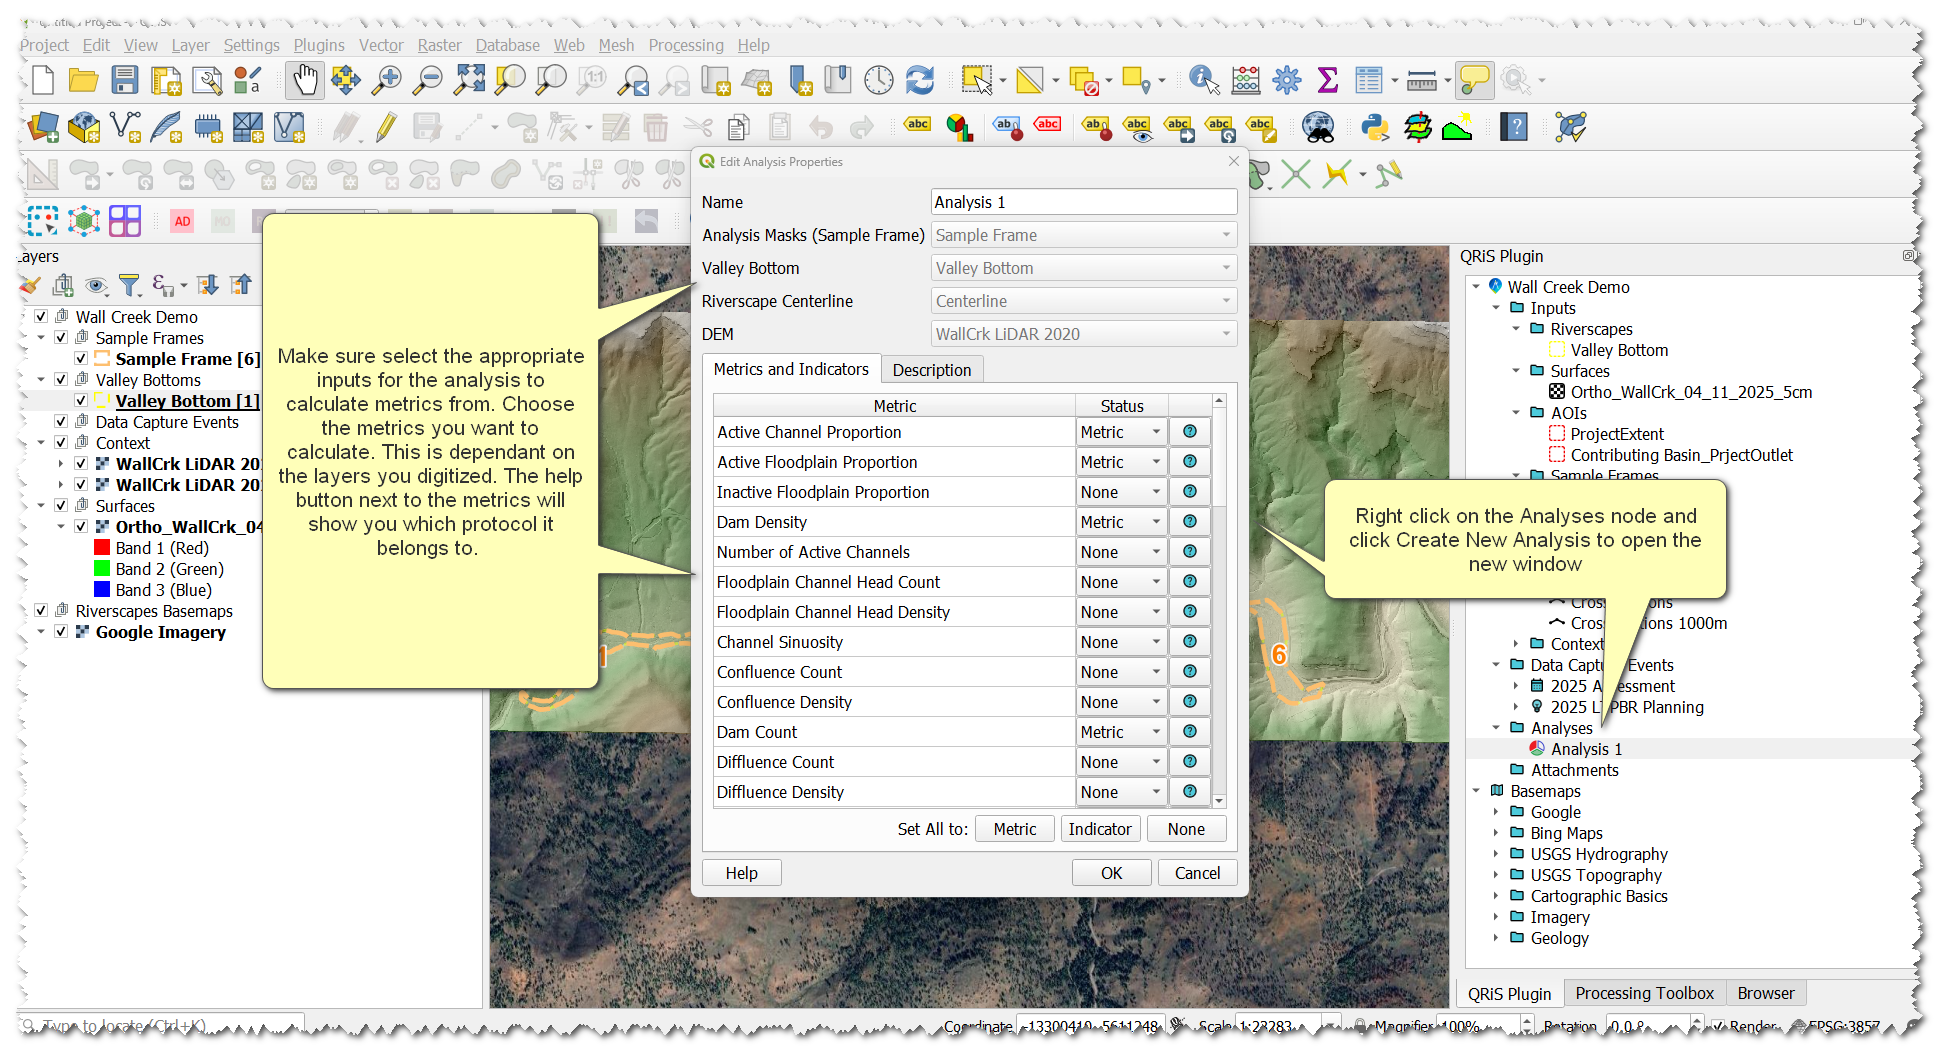
- Right-click the Analyses folder -> Create New Analysis
- Give the Analysis a name
- Select the sample frame layer you want to use to calculate metrics in
- Select the appropriate valley bottom layer, centerline layer, and DEM layer
- You will see a large list of metrics to select from. Click none at the bottom-right to set all metrics to none. Setting all to none allows you to go through and only choose the ones you want to calculate. Change the dropdown to metric on the following metrics:
- Active Floodplain Proportion
- Active Channel Proportion
- Proportion of Riverscape with Recovery Potential
- Click OK
- On the window that pops up click calculate
- On the new window select All Sample Frames and click ok
- Values will calculate and populate in the table of metrics. Under the Mask Polygon Dropdown you can switch between your different sample frames to see the different metric values.
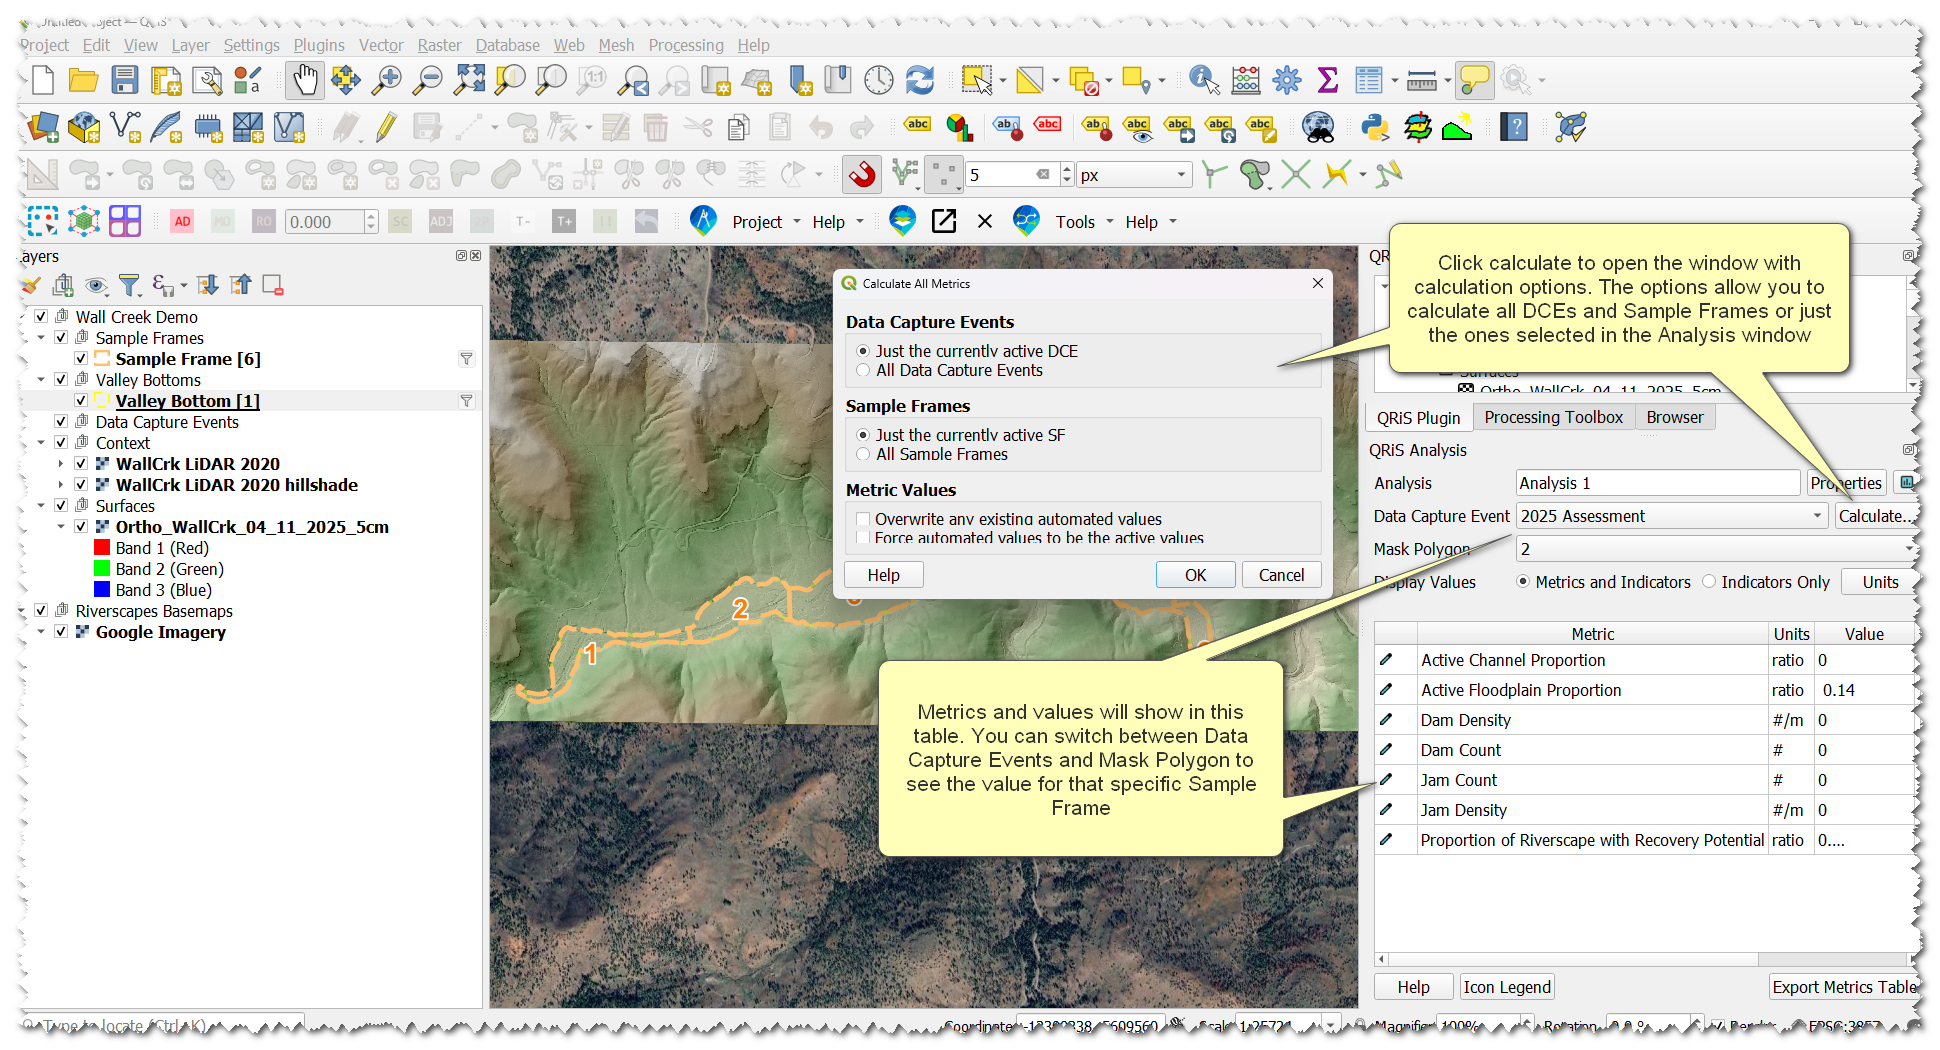
Run the Analysis three times:
- Run an analysis on Fall Creek (make sure to select all the appropriate inputs for Fall Creek )
- Run an analysis on Coburn Creek (make sure to select all the appropriate inputs for Coburn Creek)
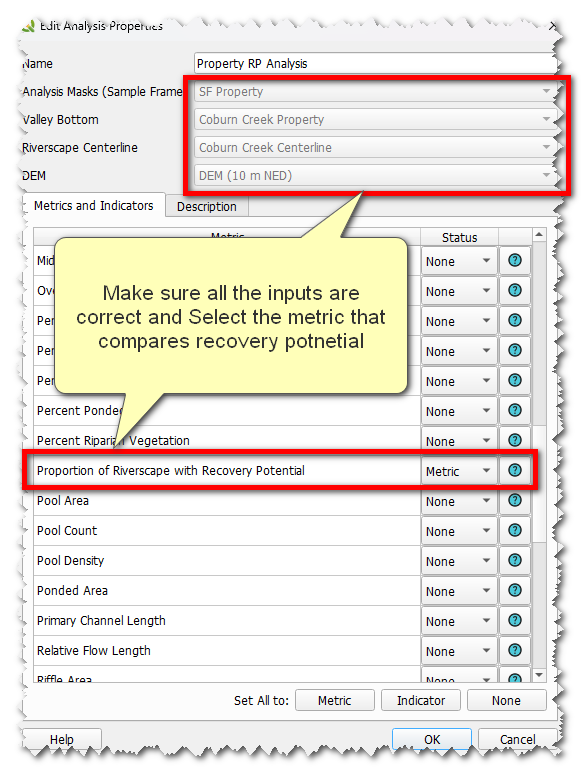
- Run an analyis to compare Carol and Pops.
- Select the SF Property layer as the sample frame input and the Coburn Creek Valley Bottom and centerlines when creating the analysis.
- Select the Proportion of Riverscape with Recovery Potential metric and set the rest to none, click ok
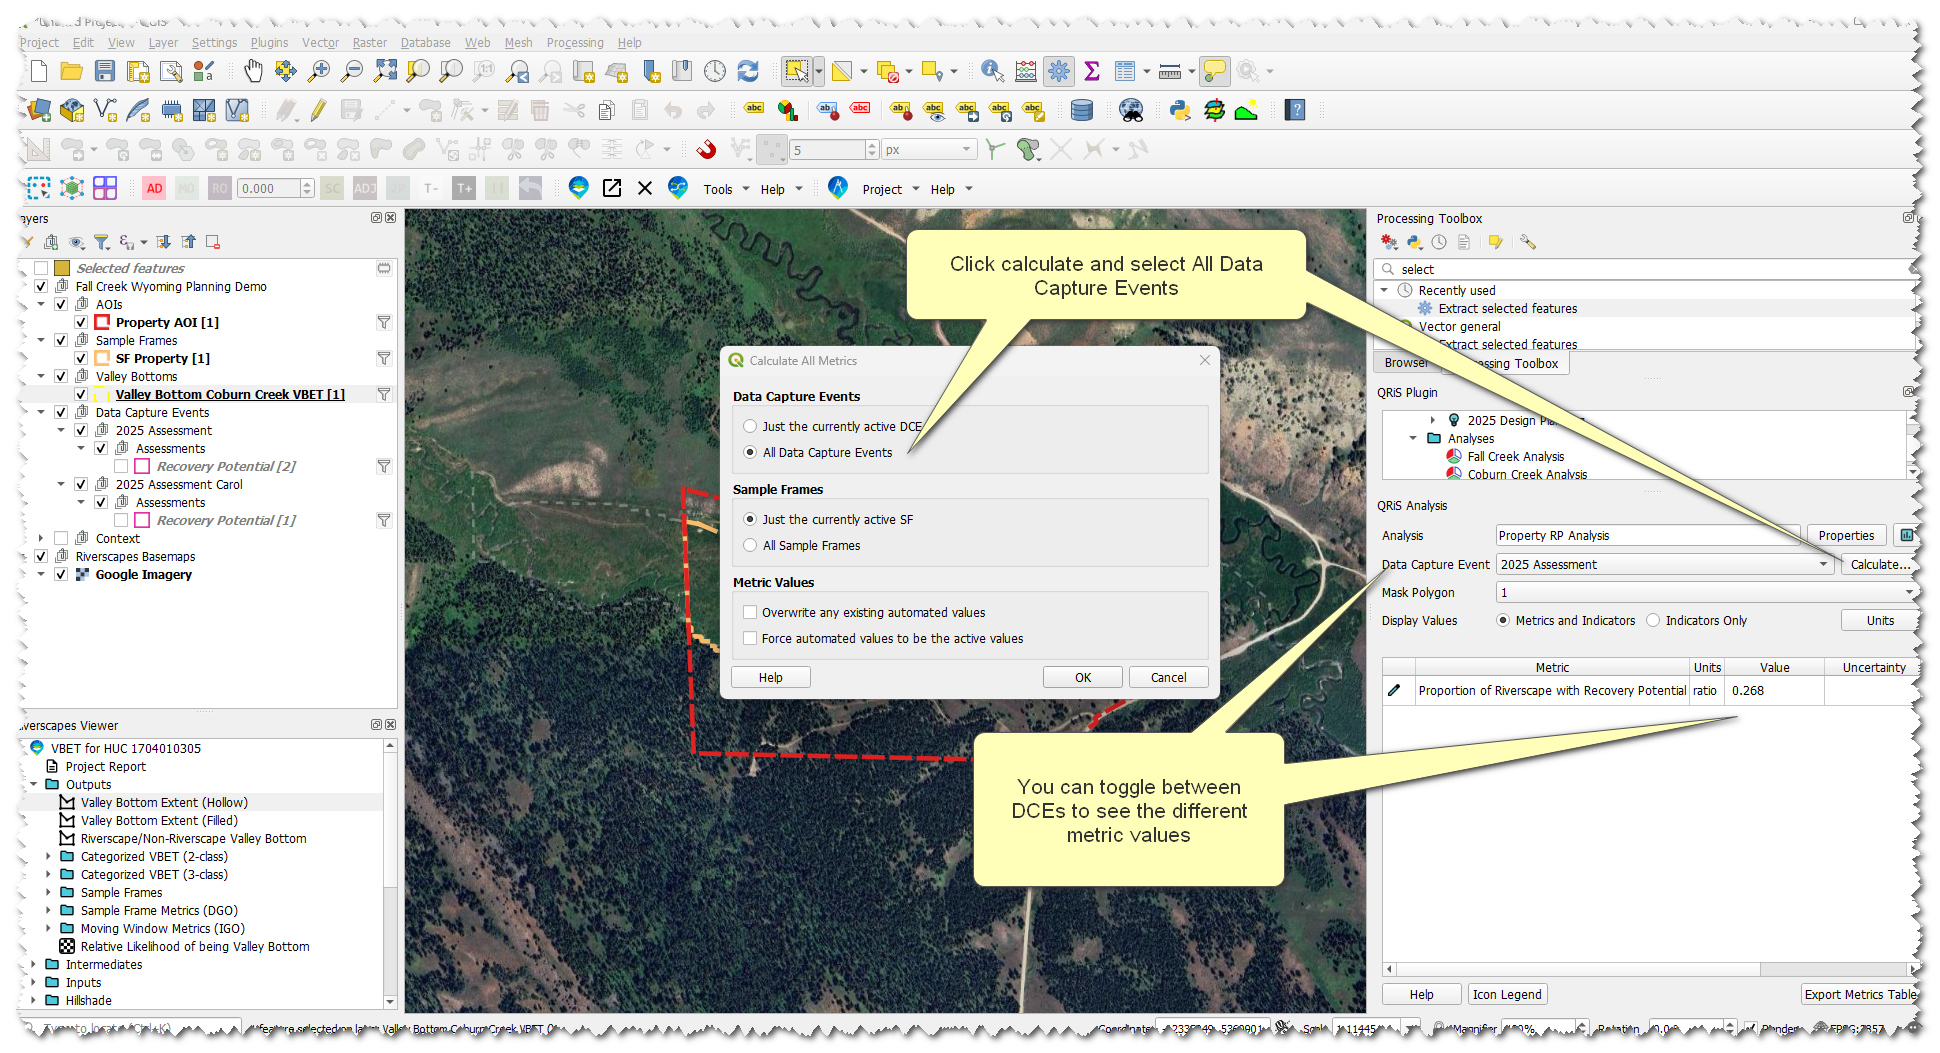
- Run the calculation, but this time check "All Data Capture Events" options, click OK
- Once it is calculated you can toggle between DCEs to see the differing values between Carol and Pops
Metrics can be recalculated at any time and values can be overridden with manual values if necessary. More help can be found on the Analyses help page.